
Hikrobot Machine Vision Software User Manual
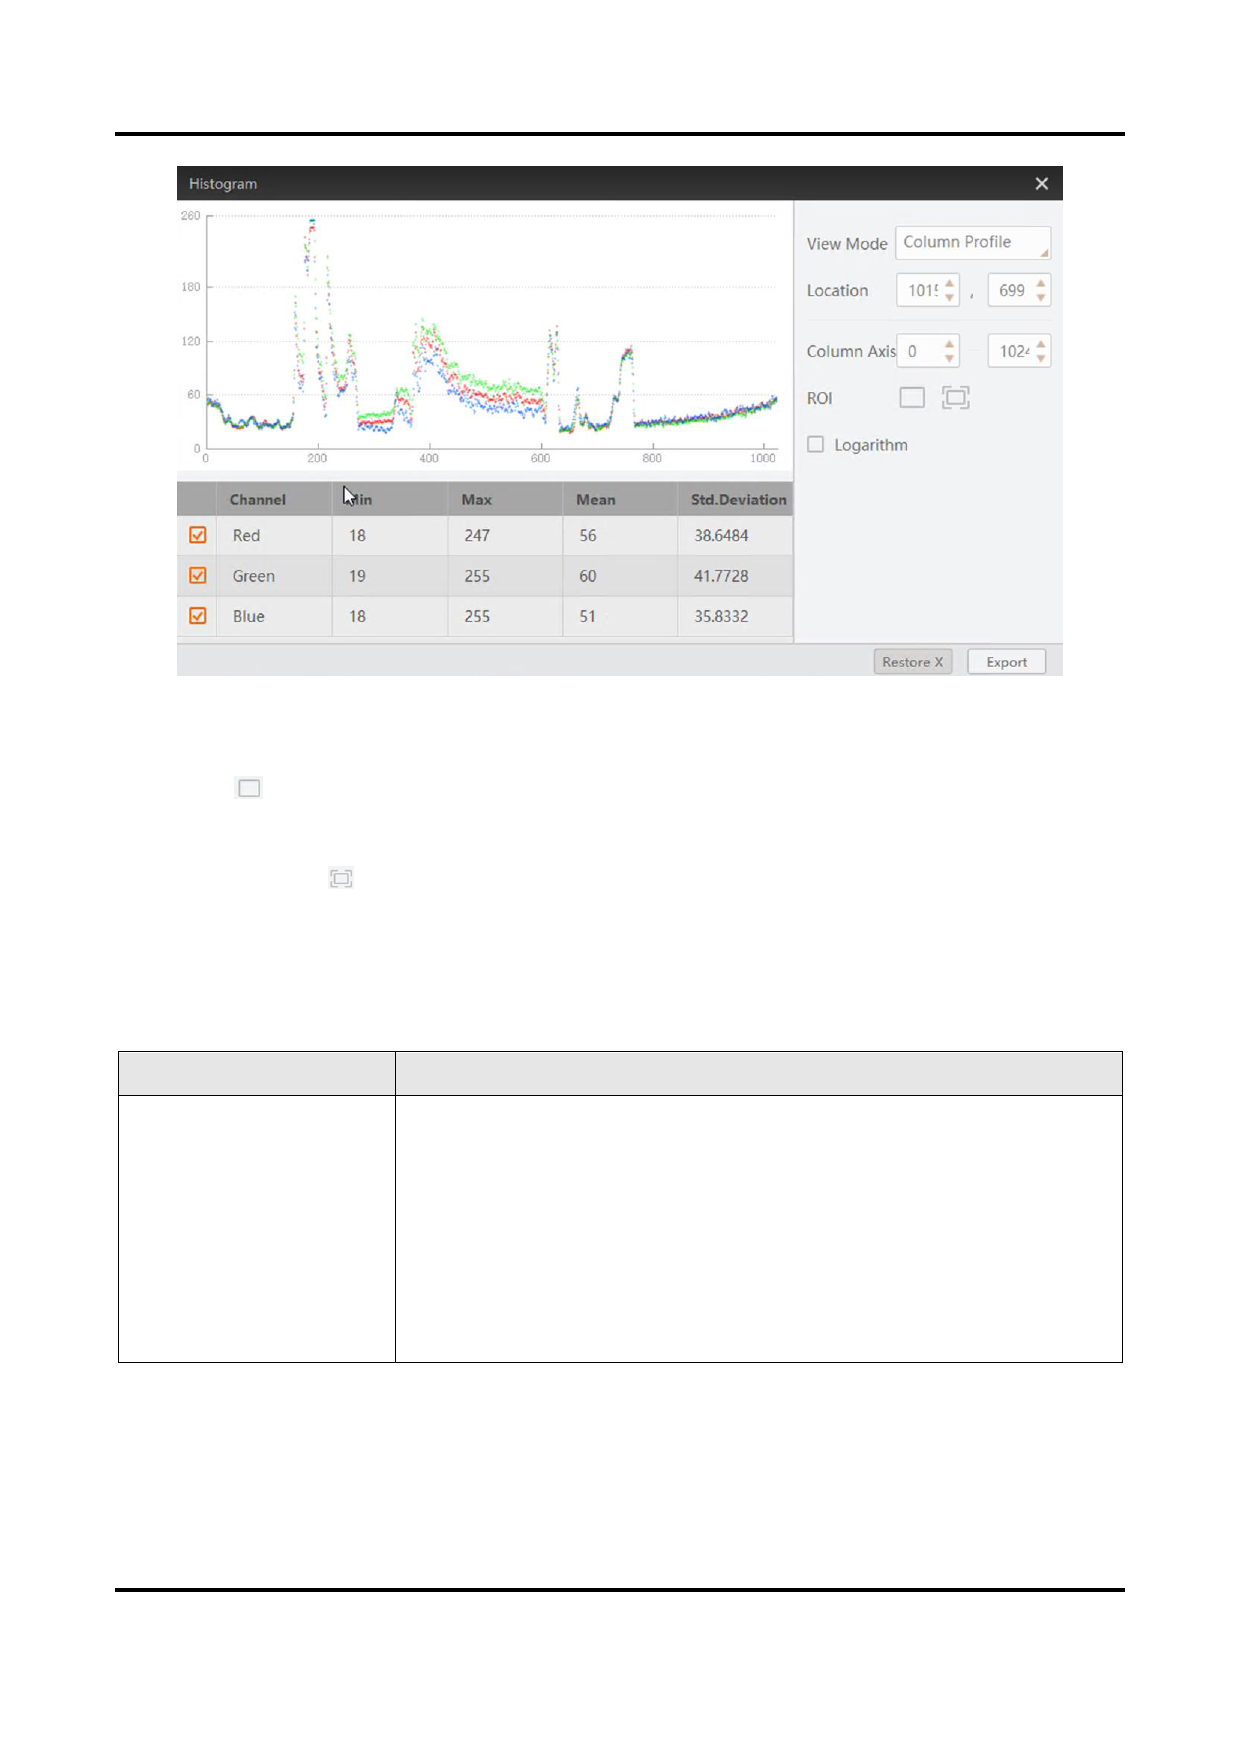
Figure 6-17 Column Profile Mode
ROI
Click and then drag the cursor on the image to draw a ROI. After that, the
histogram only displays the color channel distribution or gray value distribution within
the ROI.
You can click to cancel the ROI settings.
Logarithmic Scale
Switches between a linear and a logarithmic view of the data.
You can do the following operations if required.
Table 6-1 Available Operations
Operation
Description
Panning and Zooming
Panning and zooming allows you to look at specific areas of
the histogram in more detail.
● Panning: Drag the cursor on the histogram to pan the
histogram.
● Zooming: Move the cursor to the histogram and then scroll
the mouse wheel to zoom in or zoom out.
Scan the QR code to view the video clip which shows panning
and zooming.
101
 pdf")
 pdf")
 pdf")
 pdf")
 pdf")
 pdf")
 pdf")
 pdf")
 pdf")
 pdf")
 pdf")
 pdf")
 pdf")
 pdf")
 pdf")
 pdf")
 pdf")
 pdf")
 pdf")
 pdf")
 pdf")
 pdf")
 pdf")
 pdf")
 pdf")
 pdf")
 pdf")
 pdf")
 pdf")
 pdf")
 pdf")
 pdf")
 pdf")
 pdf")
 pdf")
 pdf")
 pdf")
 pdf")
 pdf")
 pdf")
 pdf")
 pdf")
 pdf")
 pdf")
 pdf")
 pdf")
 pdf")
 pdf")
 pdf")
 pdf")
 pdf")
 pdf")
 pdf")
 pdf")
 pdf")
 pdf")
 pdf")
 pdf")
 pdf")
 pdf")
 pdf")
 pdf")
 pdf")
 pdf")
 pdf")
 pdf")
 pdf")
 pdf")
 pdf")
 pdf")
 pdf")
 pdf")
 pdf")
 pdf")
 pdf")
 pdf")
 pdf")
 pdf")
 pdf")
 pdf")
 pdf")
 pdf")
 pdf")
 pdf")
 pdf")
 pdf")
 pdf")
 pdf")
 pdf")
 pdf")
 pdf")
 pdf")
 pdf")
 pdf")
 pdf")
 pdf")
 pdf")
 pdf")
 pdf")
 pdf")
 pdf")
 pdf")
 pdf")
 pdf")
 pdf")
 pdf")
 pdf")
 pdf")
 pdf")
 pdf")
 pdf")
 pdf")
 pdf")
 pdf")
 pdf")
 pdf")
 pdf")
 pdf")
 pdf")
 pdf")
 pdf")
 pdf")
 pdf")
 pdf")
 pdf")
 pdf")
 pdf")
 pdf")
 pdf")
 pdf")
 pdf")
 pdf")
 pdf")
 pdf")
 pdf")
 pdf")
 pdf")
 pdf")
 pdf")
 pdf")
 pdf")
 pdf")
 pdf")
 pdf")
 pdf")
 pdf")
 pdf")
 pdf")
 pdf")
 pdf")
 pdf")
 pdf")
 pdf")
 pdf")
 pdf")