Draw a Region for Temperature Screening
To perform temperature screening configurations, you need to first draw regions for temperature screening.
Make sure you have connected an infrared camera to the Software.
-
Click
 above the live view
window.
above the live view
window.
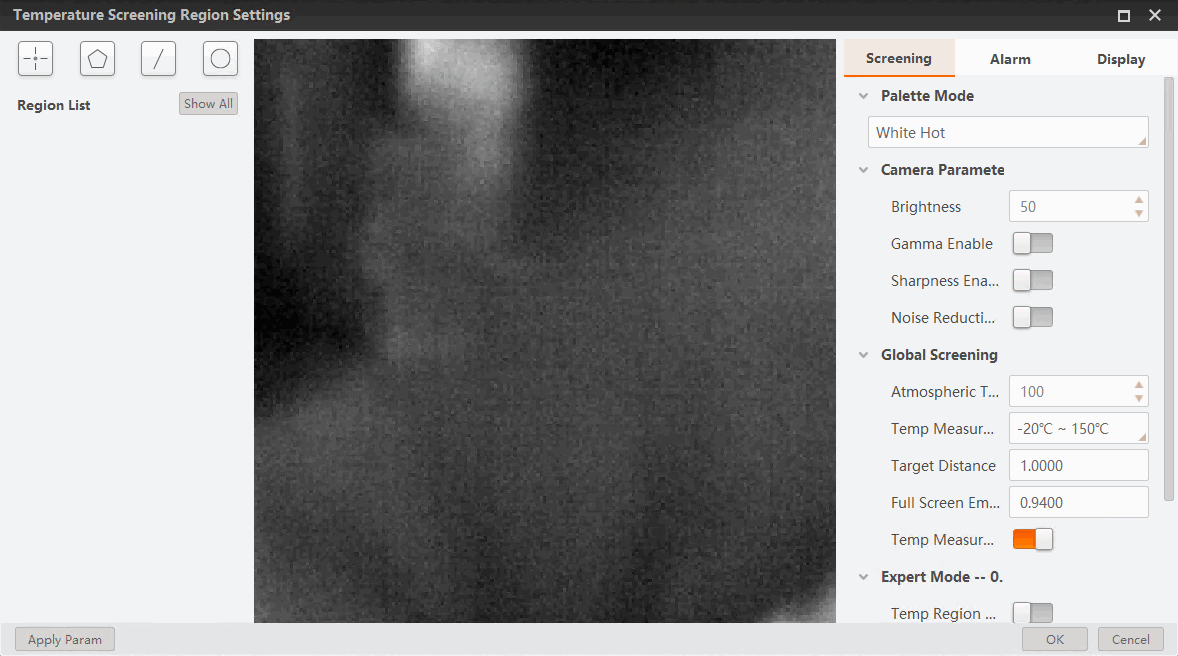 Figure 1 Temperature Screening
Region Settings Window
Figure 1 Temperature Screening
Region Settings Window -
On the top left of the configuration window, select a type of temperature
screening region according to the table below.
Table 1 Temperature Screening Region Type Icon
Region Type
Maximum No. Allowed

Point
10

Polygon
10

Line
1

Circle
1
The corresponding type of region will be added to Region List in the format "index.Type" (e.g., 0.Point). For each region type, the index starts with 0 and increases by one each time.
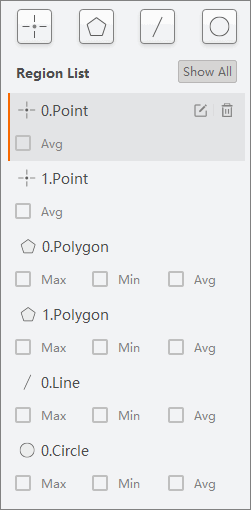 Figure 2 Example of Region
List
Figure 2 Example of Region
List -
From the list, select a region to be drawn, click
 , and draw on the live view window following the
instructions below.
, and draw on the live view window following the
instructions below.
Region Type
Drawing Instruction
Point
Click to draw a point.
Polygon
Click to draw the first vertex of the polygon, move your cursor and click again to draw more vertices as needed, and double-click to finish drawing.
Line
Click to draw one end of the line, move your cursor, and click to draw the other one.
Circle
Click, hold, and drag to draw a circle.
Note:If needed, after a region is drawn, you can click
to draw again. - Optional:
Select a region from the list and click
 to delete it if needed.
-
On the bottom left of the configuration window, click Apply
Param to save your settings.
The regions you have drawn and their corresponding real-time statistics will be displayed on the live view window.
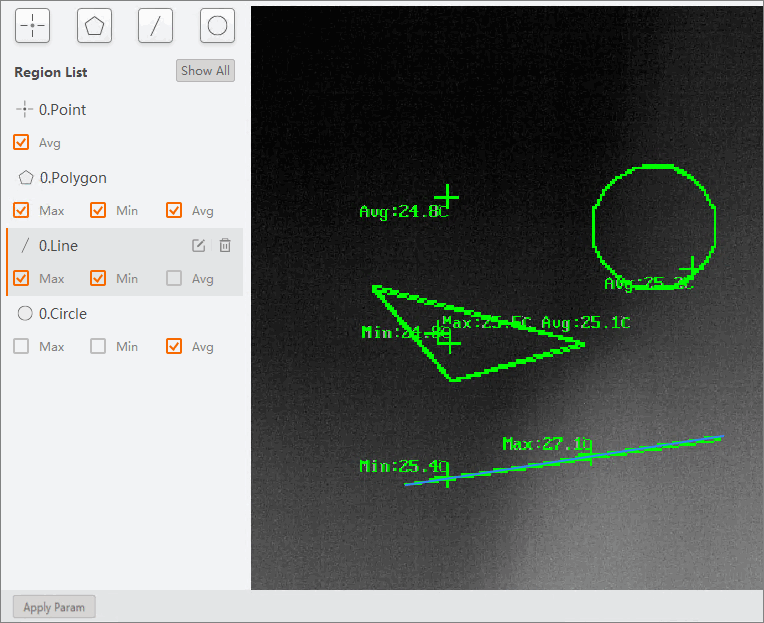 Figure 3 Temperature Screening
Regions and Statistics
Figure 3 Temperature Screening
Regions and Statistics