View Histogram
The Histogram functionality allows you to quickly evaluate the image quality by viewing the real-time distribution of different color channels (for color camera) or the real-time distribution of gray values in the images (for mono camera).
The following text only takes viewing the histogram data of color camera for an example.
Start acquisition and then click  to open the Histogram window.
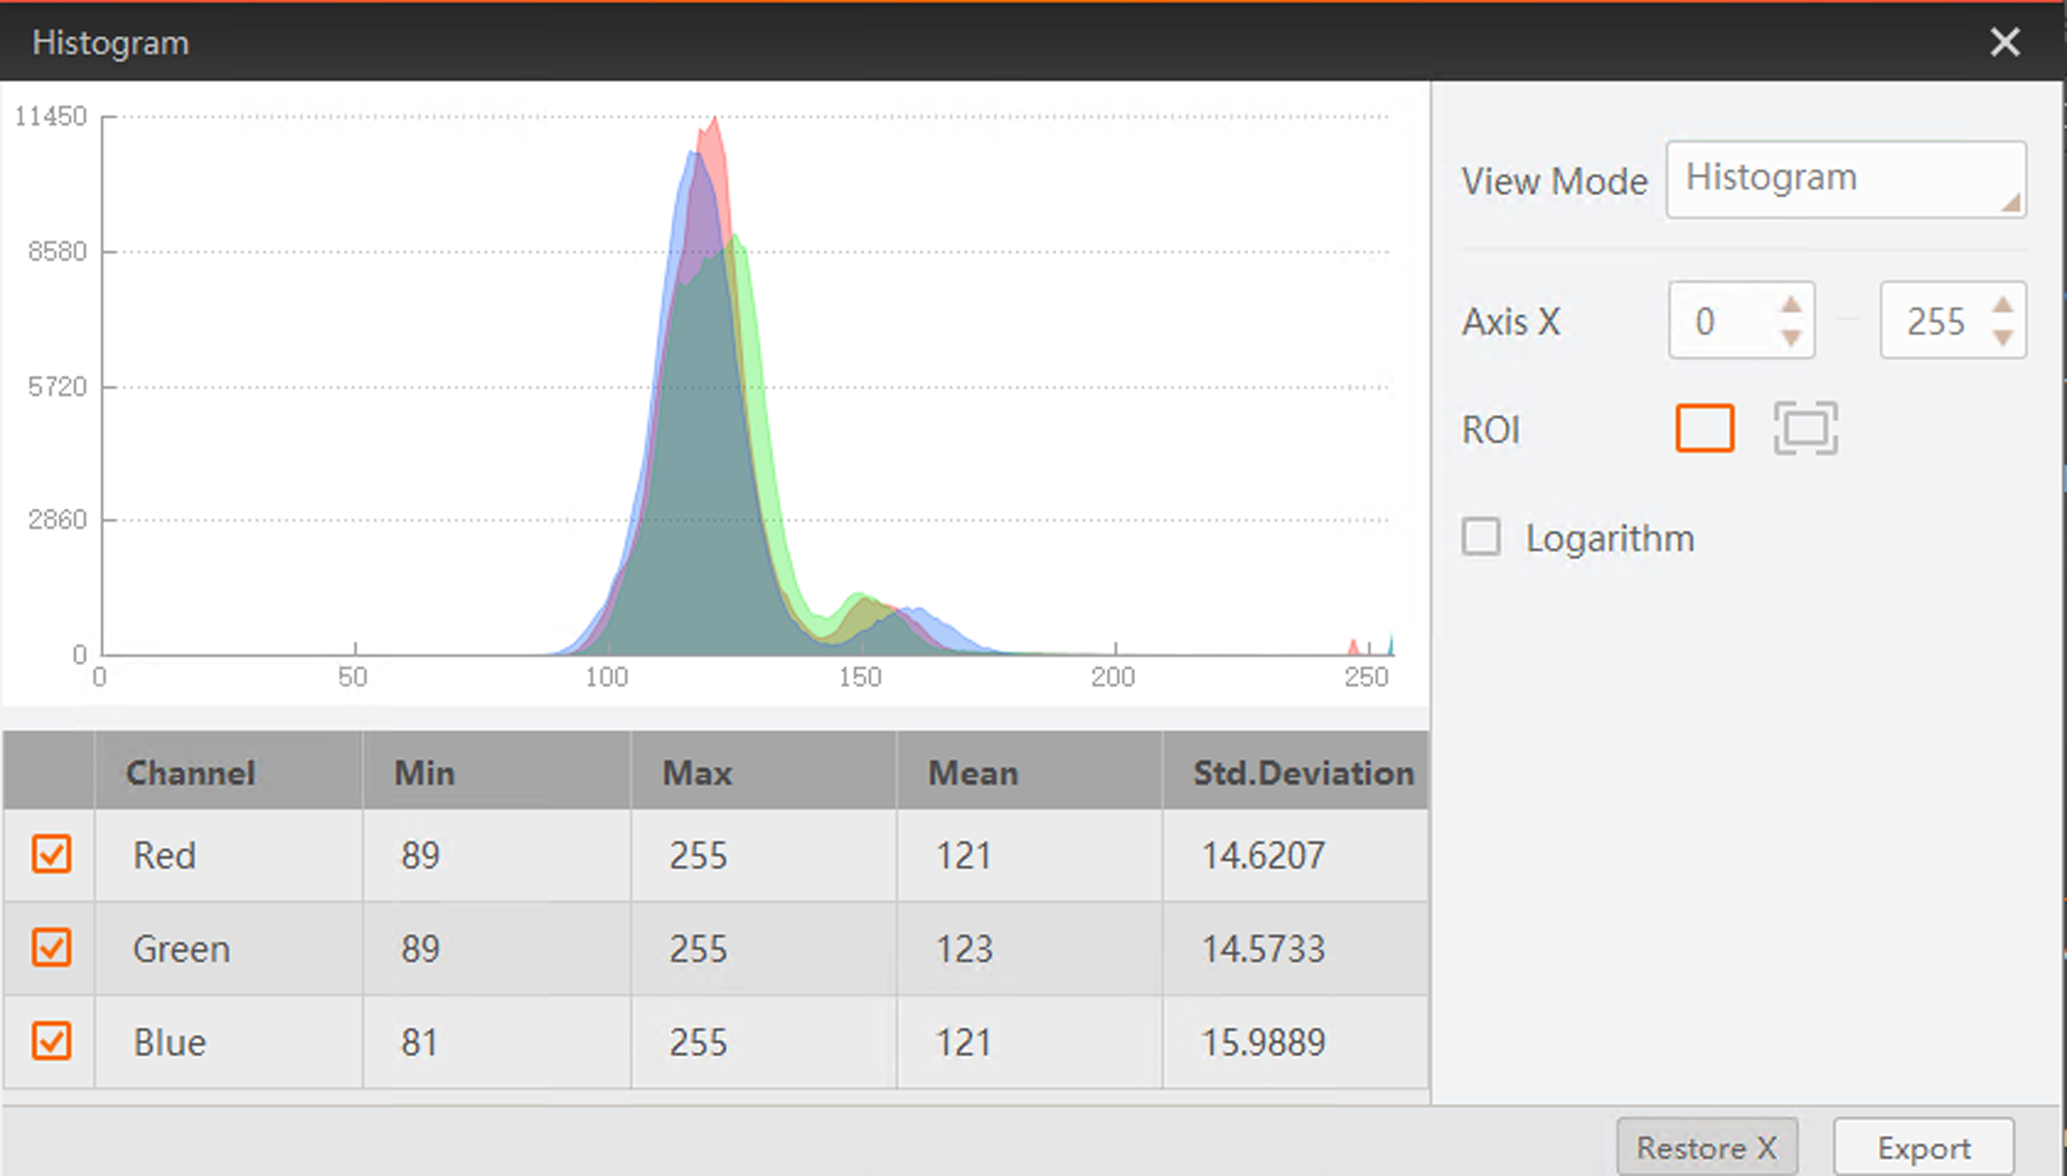 Figure 1 The Histogram Window
- View Mode
-
Set the view modes, including Histogram, Line Profile and Column Profile.
- Histogram
- Line Profile
-
- Location
-
Display the coordinates value of your cursor when you moving your cursor on the images.
- Line Axis
-
Set the value range (0 to the horizontal resolution of the image) of the selected line which is parallel with the X axis.
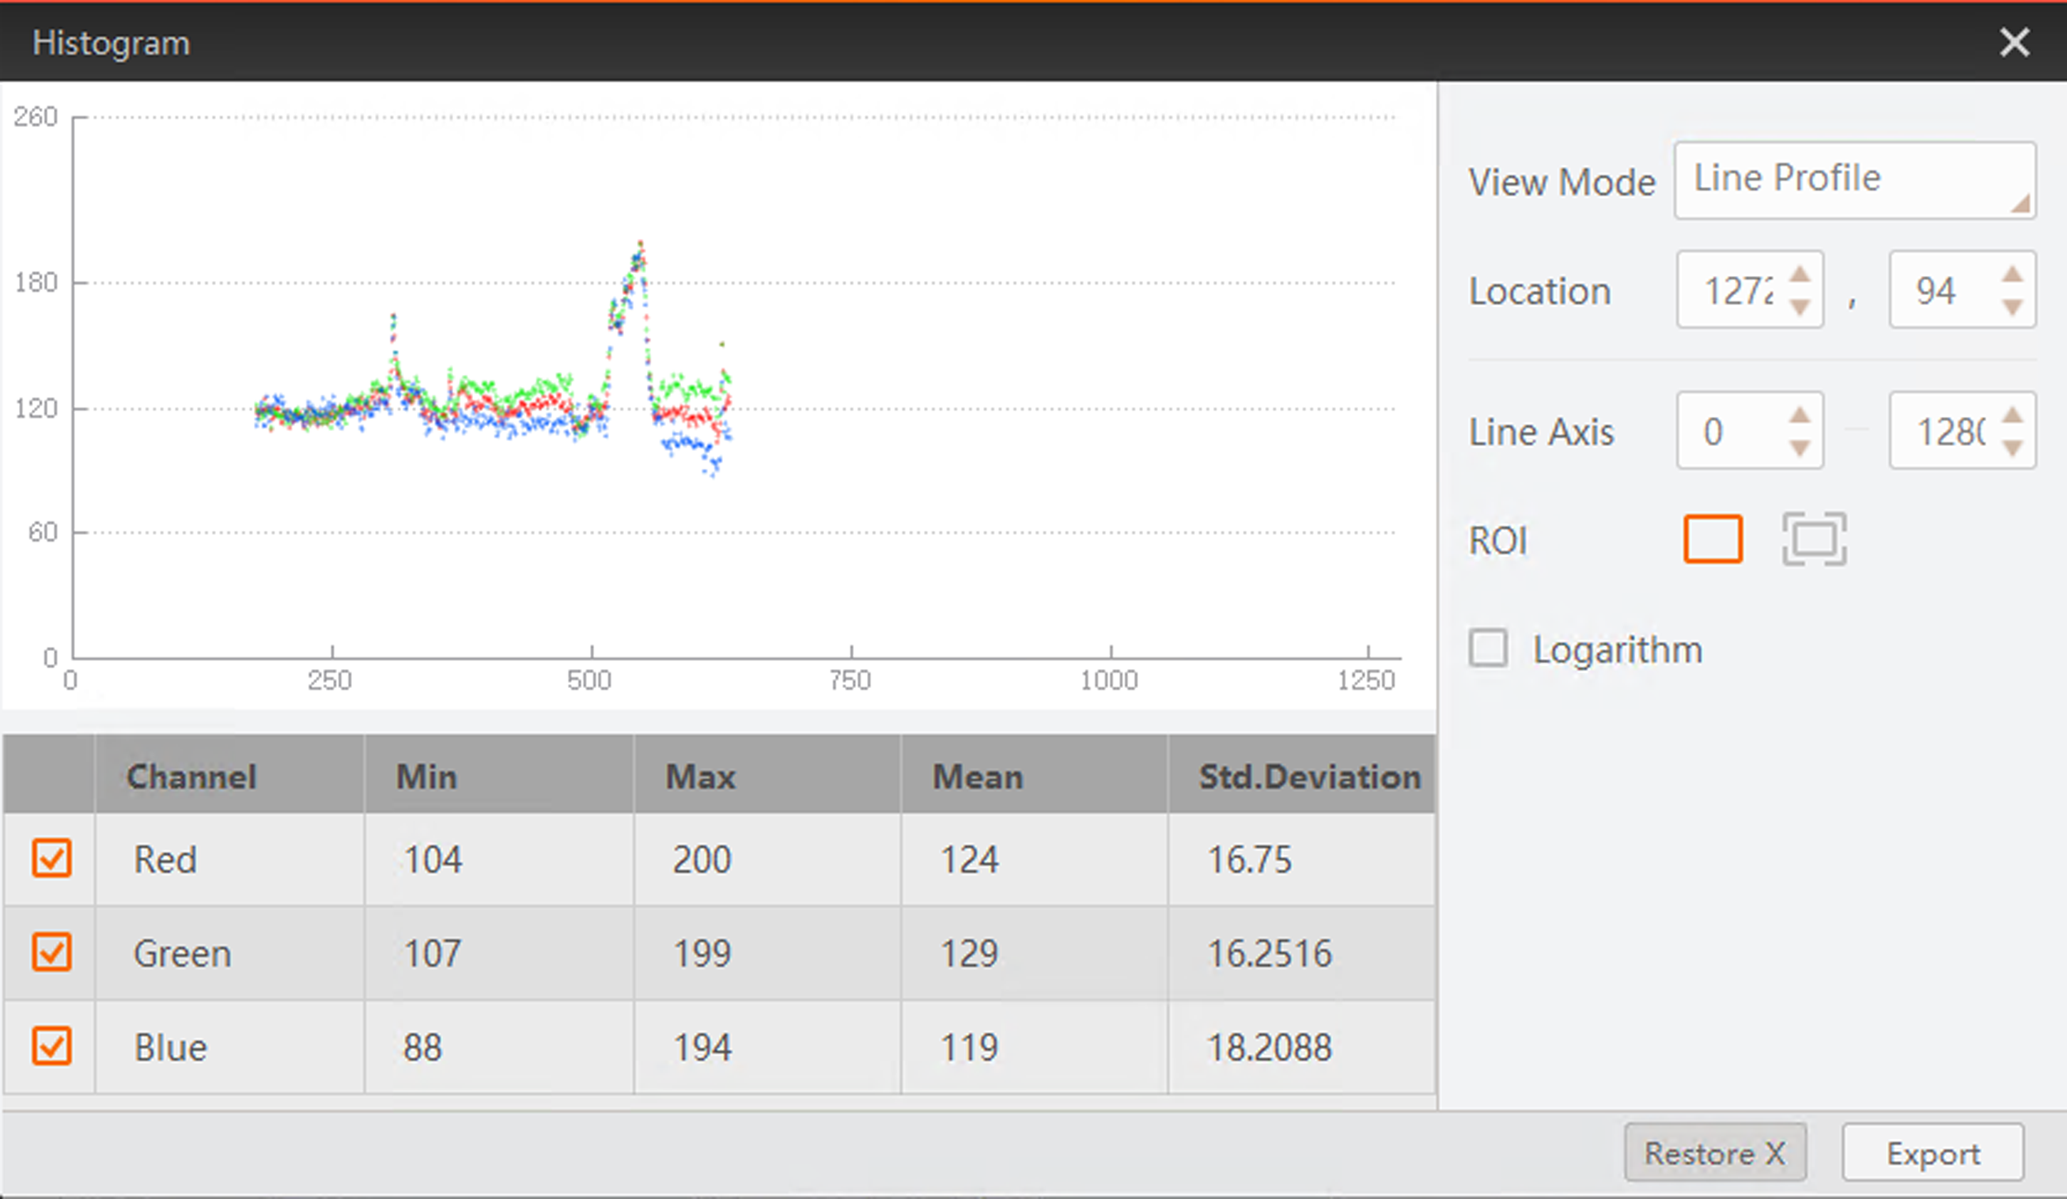 Figure 2 Line
Profile Mode
Figure 2 Line
Profile Mode - Column Profile
-
- Location
-
Display the coordinates value of your cursor when you moving your cursor on the images.
- Column Axis
-
Set the value range (0 to the vertical resolution of the image) of the selected line which is parallel with the X axis.
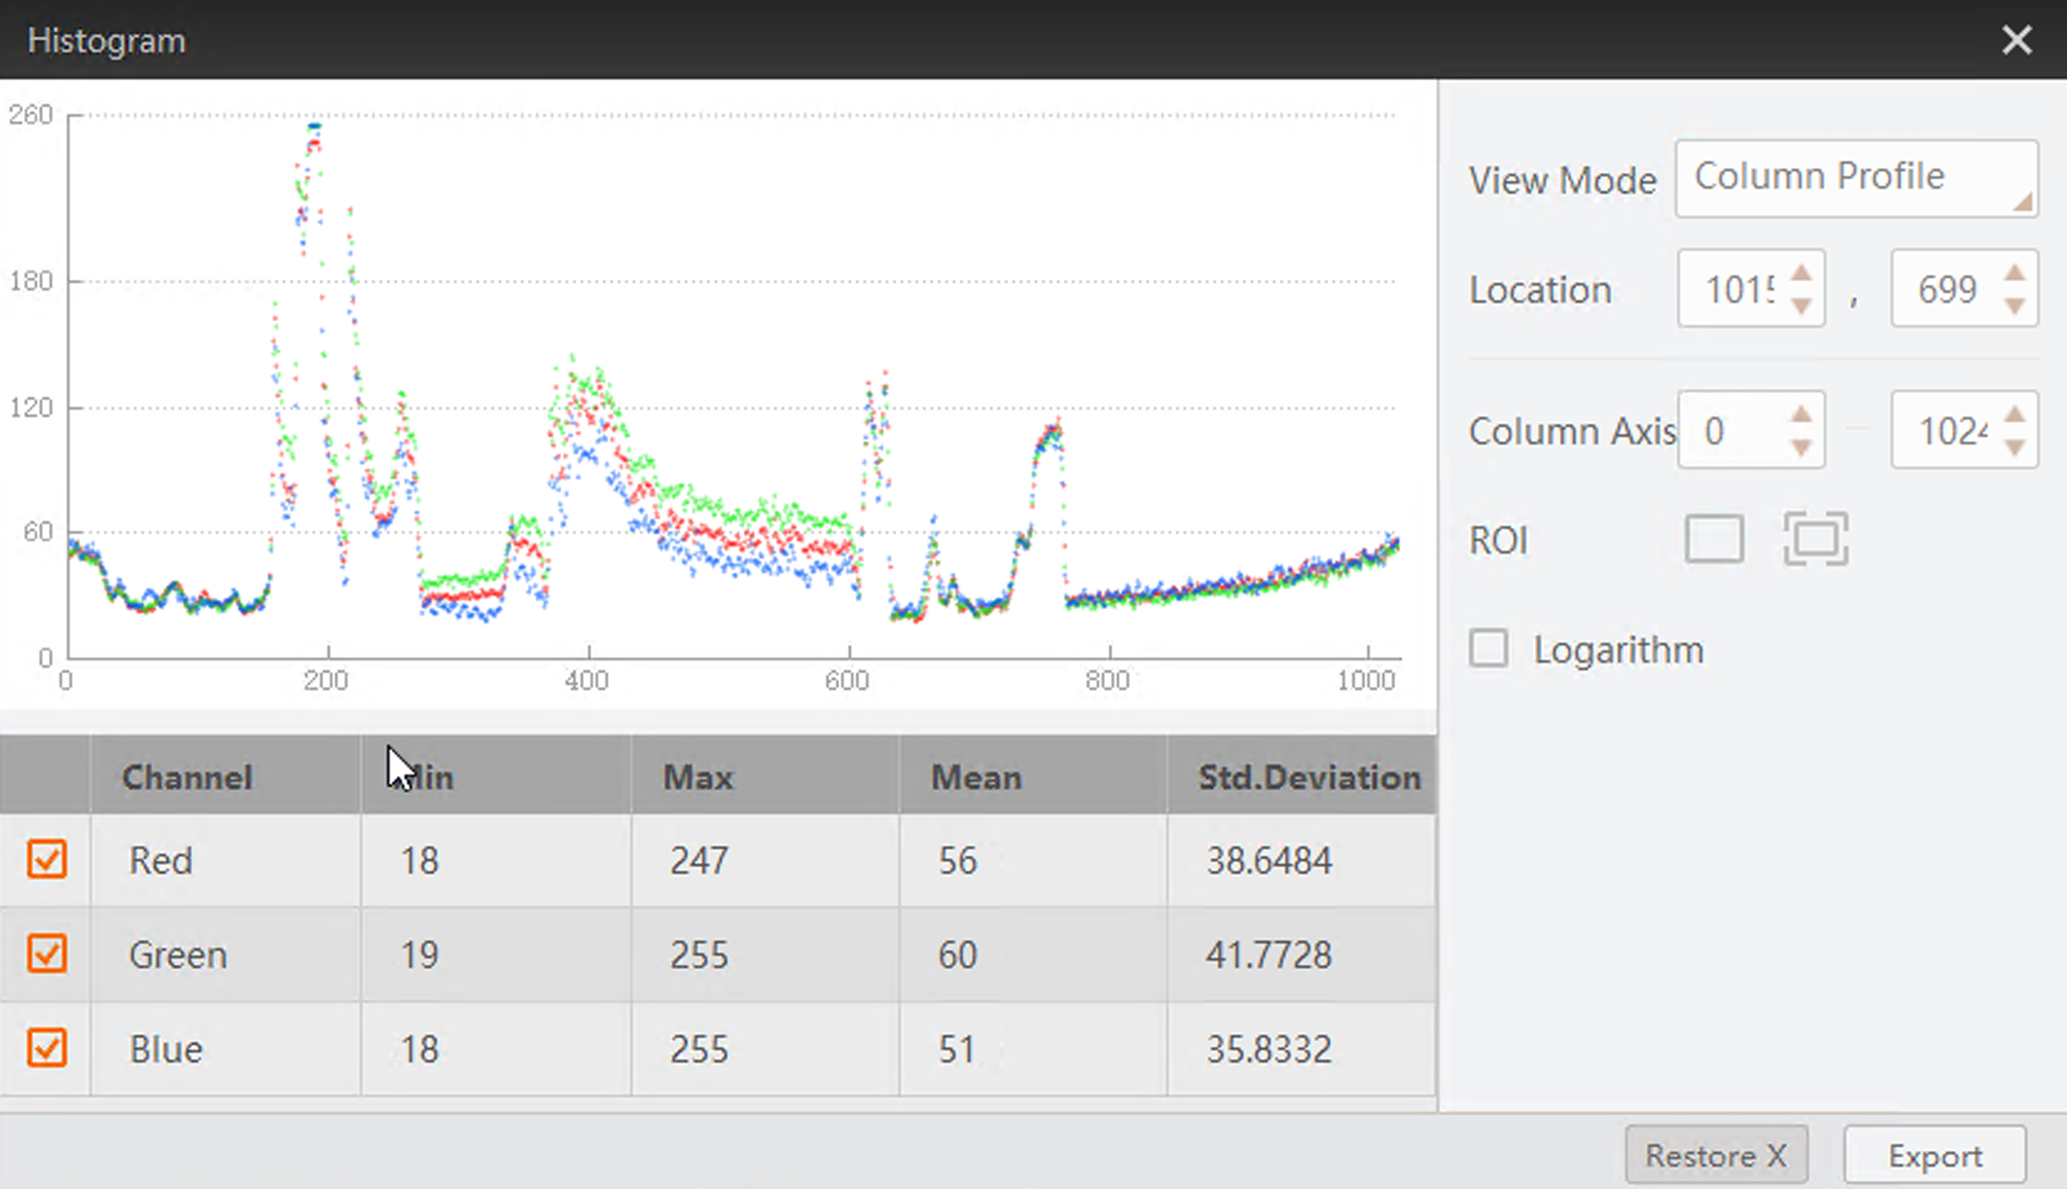 Figure 3 Column Profile Mode
 - ROI
-
Click
 and then drag
the cursor on the image to draw a ROI. After that, the histogram
only displays the color channel distribution or gray value
distribution within the ROI.
and then drag
the cursor on the image to draw a ROI. After that, the histogram
only displays the color channel distribution or gray value
distribution within the ROI.You can click
 to cancel the
ROI settings.
to cancel the
ROI settings. - Logarithmic Scale
-
Switches between a linear and a logarithmic view of the data.
You can do the following operations if required.
|
Operation |
Description |
|---|---|
|
Panning and Zooming |
Panning and zooming allows you to look at specific areas of the histogram in more detail.
Scan the QR code to view the video clip which shows panning and zooming. 
|
|
Select Color Channel for Display |
If the camera is a color camera, you can check the checkbox(es) in the table, the selected color channel's real-time distribution will be displayed on the histogram. |
|
Export Histogram Data |
Click Export to export the histogram data to the local PC. |
|
Restore X |
Click Restore X to restore the coordinates if you have zoomed the histogram. |