Diagnostic Tool
You can use the Diagnostic Tool to diagnose the running environment and the secondary development environment, and then optimize the environments basing on the detected exceptions.
Diagnose the running environment first (see Diagnose Running Environment), and then optimize the running environment (see Optimize Environment, and finally check and resolve specific exception(s) (see Check and Resolve a Specific Exception).
Diagnose Running Environment
You can search Diagnostic_Tool.exe in the Start menu, and then click the found Diagnostic_Tool.exe to run the Diagnostic Tool.
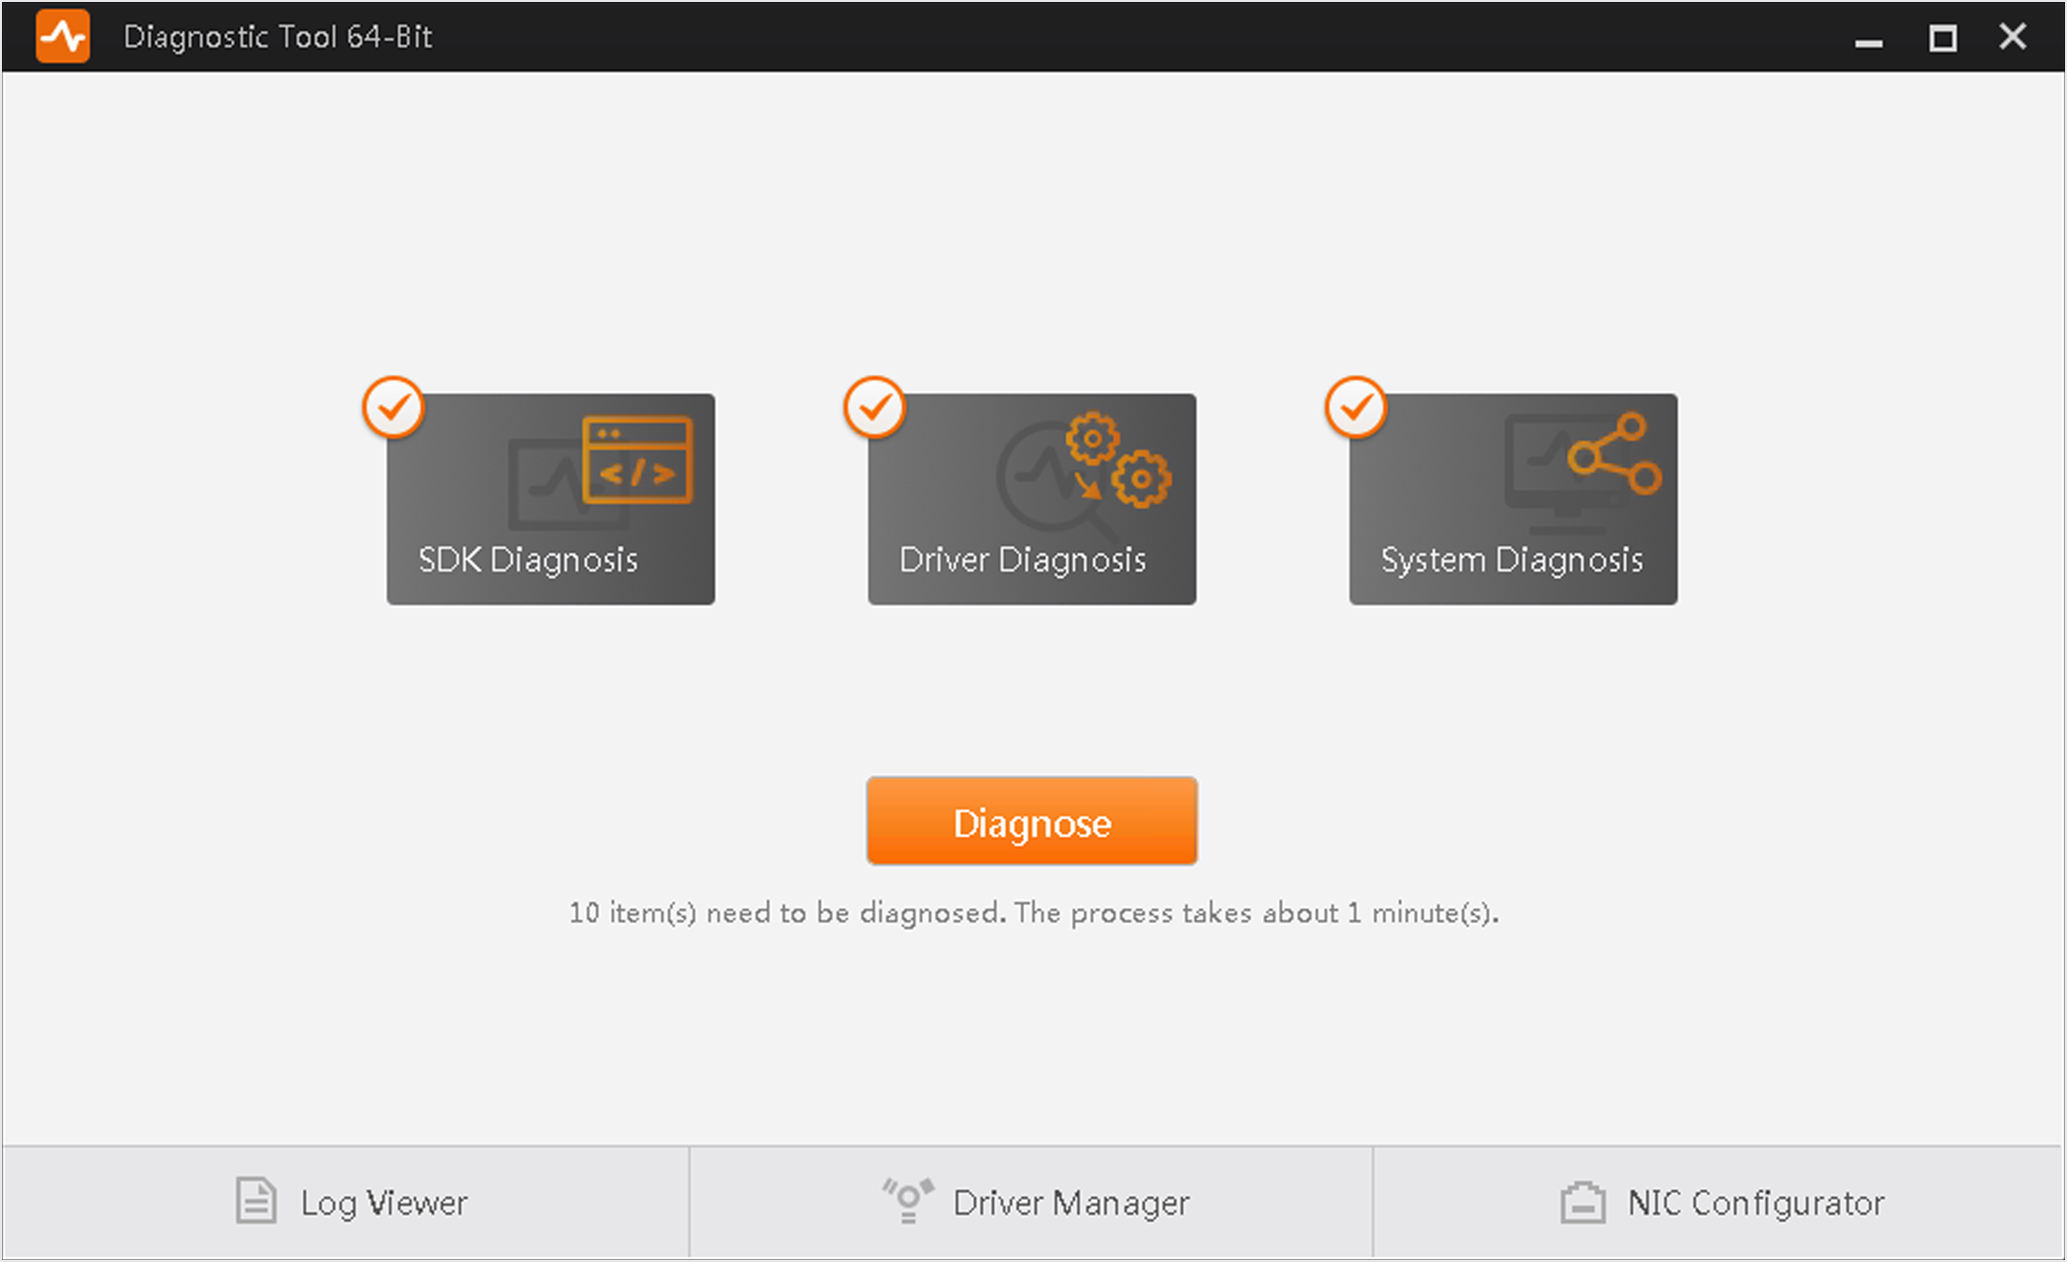 Figure 1 Diagnostic Tool
You can select SDK Diagnosis, Driver Diagnosis, or (and) System Diagnosis, and then click Diagnose to start diagnosing.
- SDK Diagnosis
-
Diagnose the secondary development environment.
- Driver Diagnosis, System Diagnosis
-
Diagnose the Software running environment.
While diagnosing, you can also click the tool(s) at the bottom of the page to help the diagnostics work.
- Log Viewer
-
View the SDK logs. For details, see Log Viewer Tool.
- Driver Manager
-
Manage the GigE Vision driver and the USB driver. For details, see Driver Manager.
- NIC Configurator
-
Configure the PC's network adapter parameters. For details, seeNIC Configurator.
When diagnosis ends, the exception number of each type of the diagnosis results (Serious, Fatal, or Normal) will be displayed, and all the exceptions will be displayed by different categories. You can view and handle each one of them respectively.
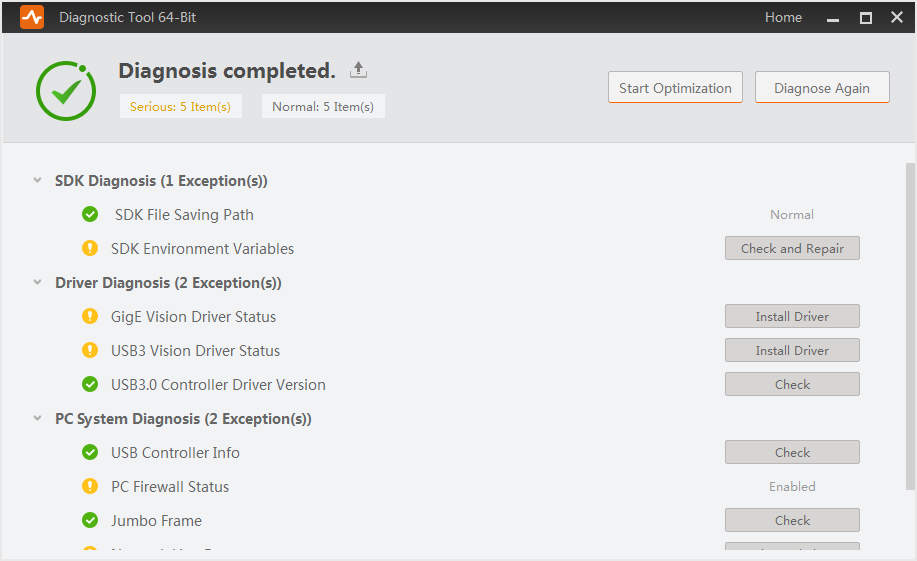 Figure 2 Diagnosis Completed
|
Result Type |
Description |
|---|---|
|
Fatal |
The exceptions that may cause fatal problems such as system crash or secondary development failure. |
|
Serious |
The exceptions that may cause serious problems such as streaming failure. |
|
Normal |
The item is normal and is marked with |
 .
.Optimize Environment
If exception(s) are detected after diagnosis, you can click Start Optimization to optimize the Software running environment and the secondary development environment.
After optimization, you may still need to resolve some exceptions manually. Take network line rate exception (lower than 1Gbps) for an example, you need to manually check if the NIC, network or the switch is abnormal.
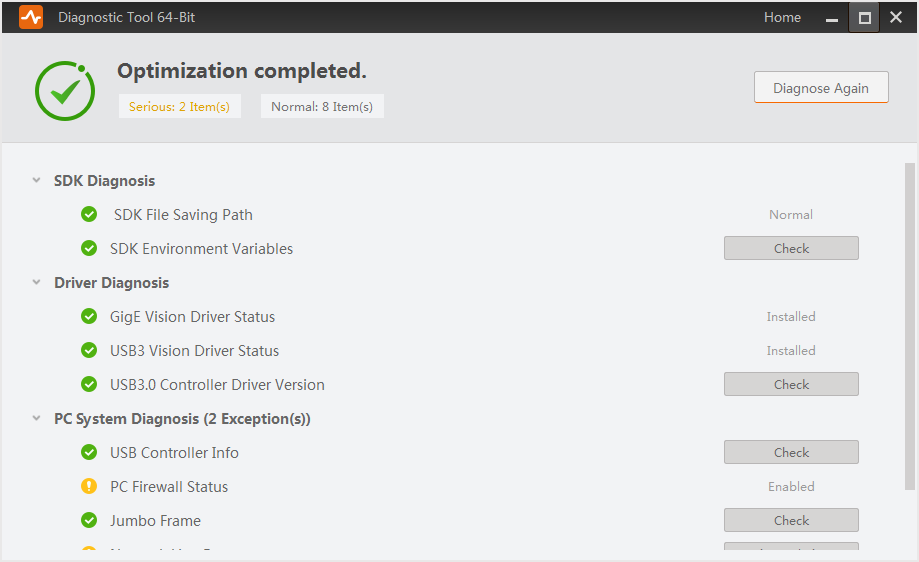 Figure 3 Optimization Completed
Check and Resolve a Specific Exception
The Diagnostic Tool can detect various types of exceptions, including the exception that SDK files are copied to multiple saving paths, environment variable exception, driver exception, USB controller exception, Jumbo Frame exception, and network line rate exception.
-
For the exception that SDK files are copied to multiple saving paths, you can click Check, and then delete a specific SDK file or click Clear All to clear all the SDK files.
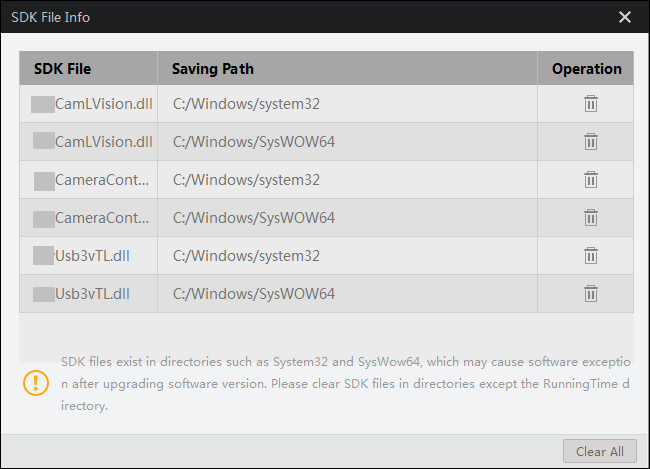 Figure 4 SDK Files Copied to
Multiple Saving Paths
Figure 4 SDK Files Copied to
Multiple Saving Paths -
For environment variable exception, you can click Repair to repair the detected problems.
If no exception is detected, you can also click Check to view the variable information such as variable name and status.
-
For driver exception, you can click Check to view the driver information such as the driver version and driver's latest update time.
-
For USB controller exception, you can click Check to view the USB controller information, such as driver key, device ID, and vendor ID.
-
For Jumbo Frame exception, you can click Check to view whether Jumbo Frame of the network adapter is enabled or not and the Jumbo Frame value (if enabled).
Note:To ensure data transmission efficiency, make sure that Jumbo Frame is enabled.
-
For network line rate exception, you can click View Solution to view the exception details and solution.
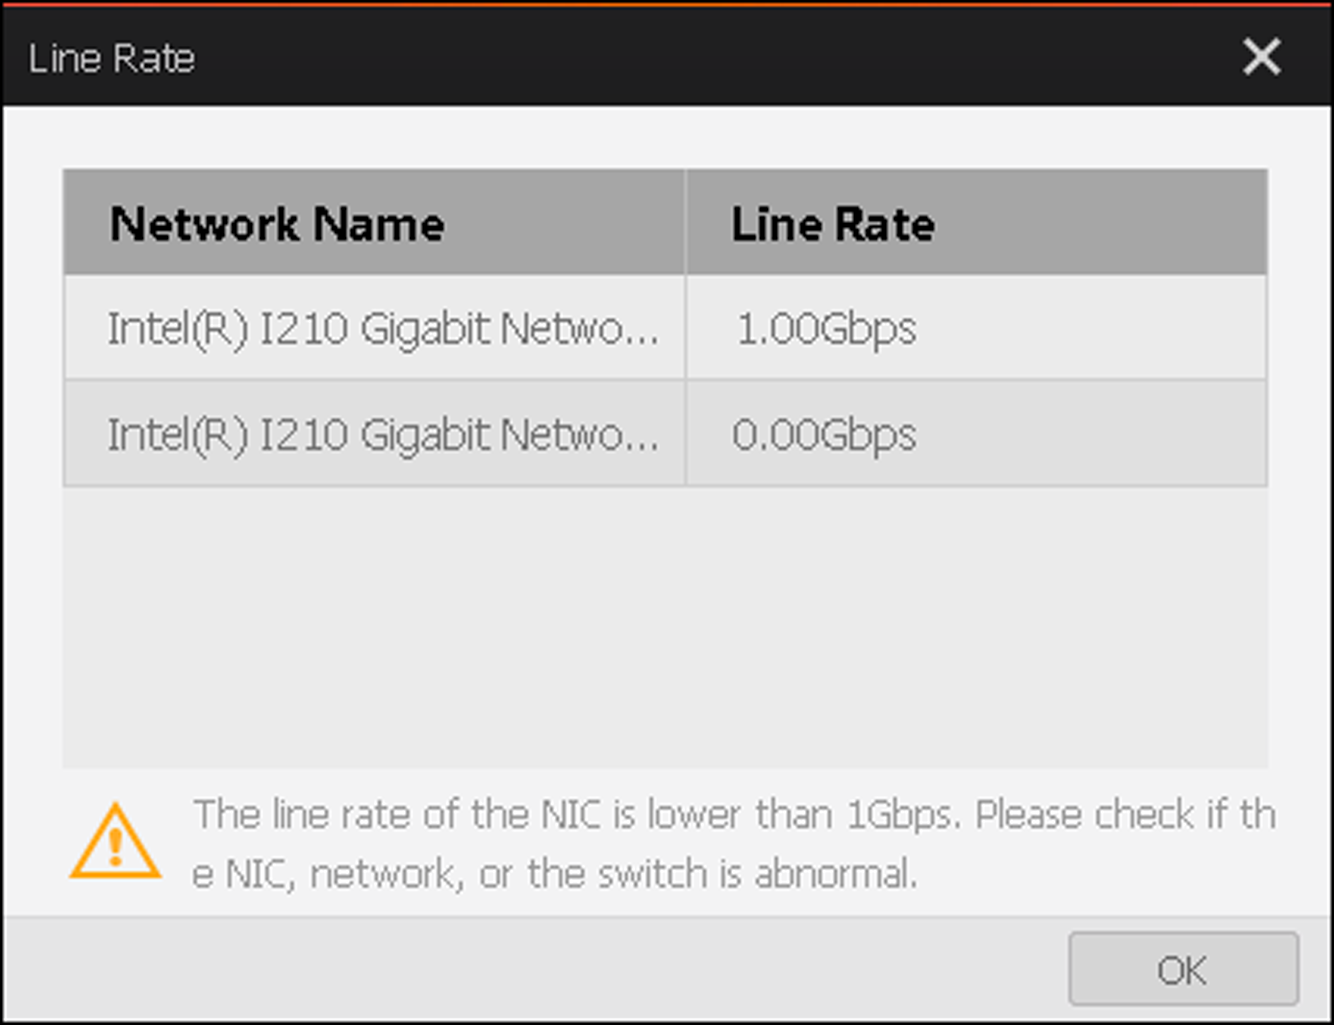 Figure 5 Line Rate Exception