Page 59 of 72
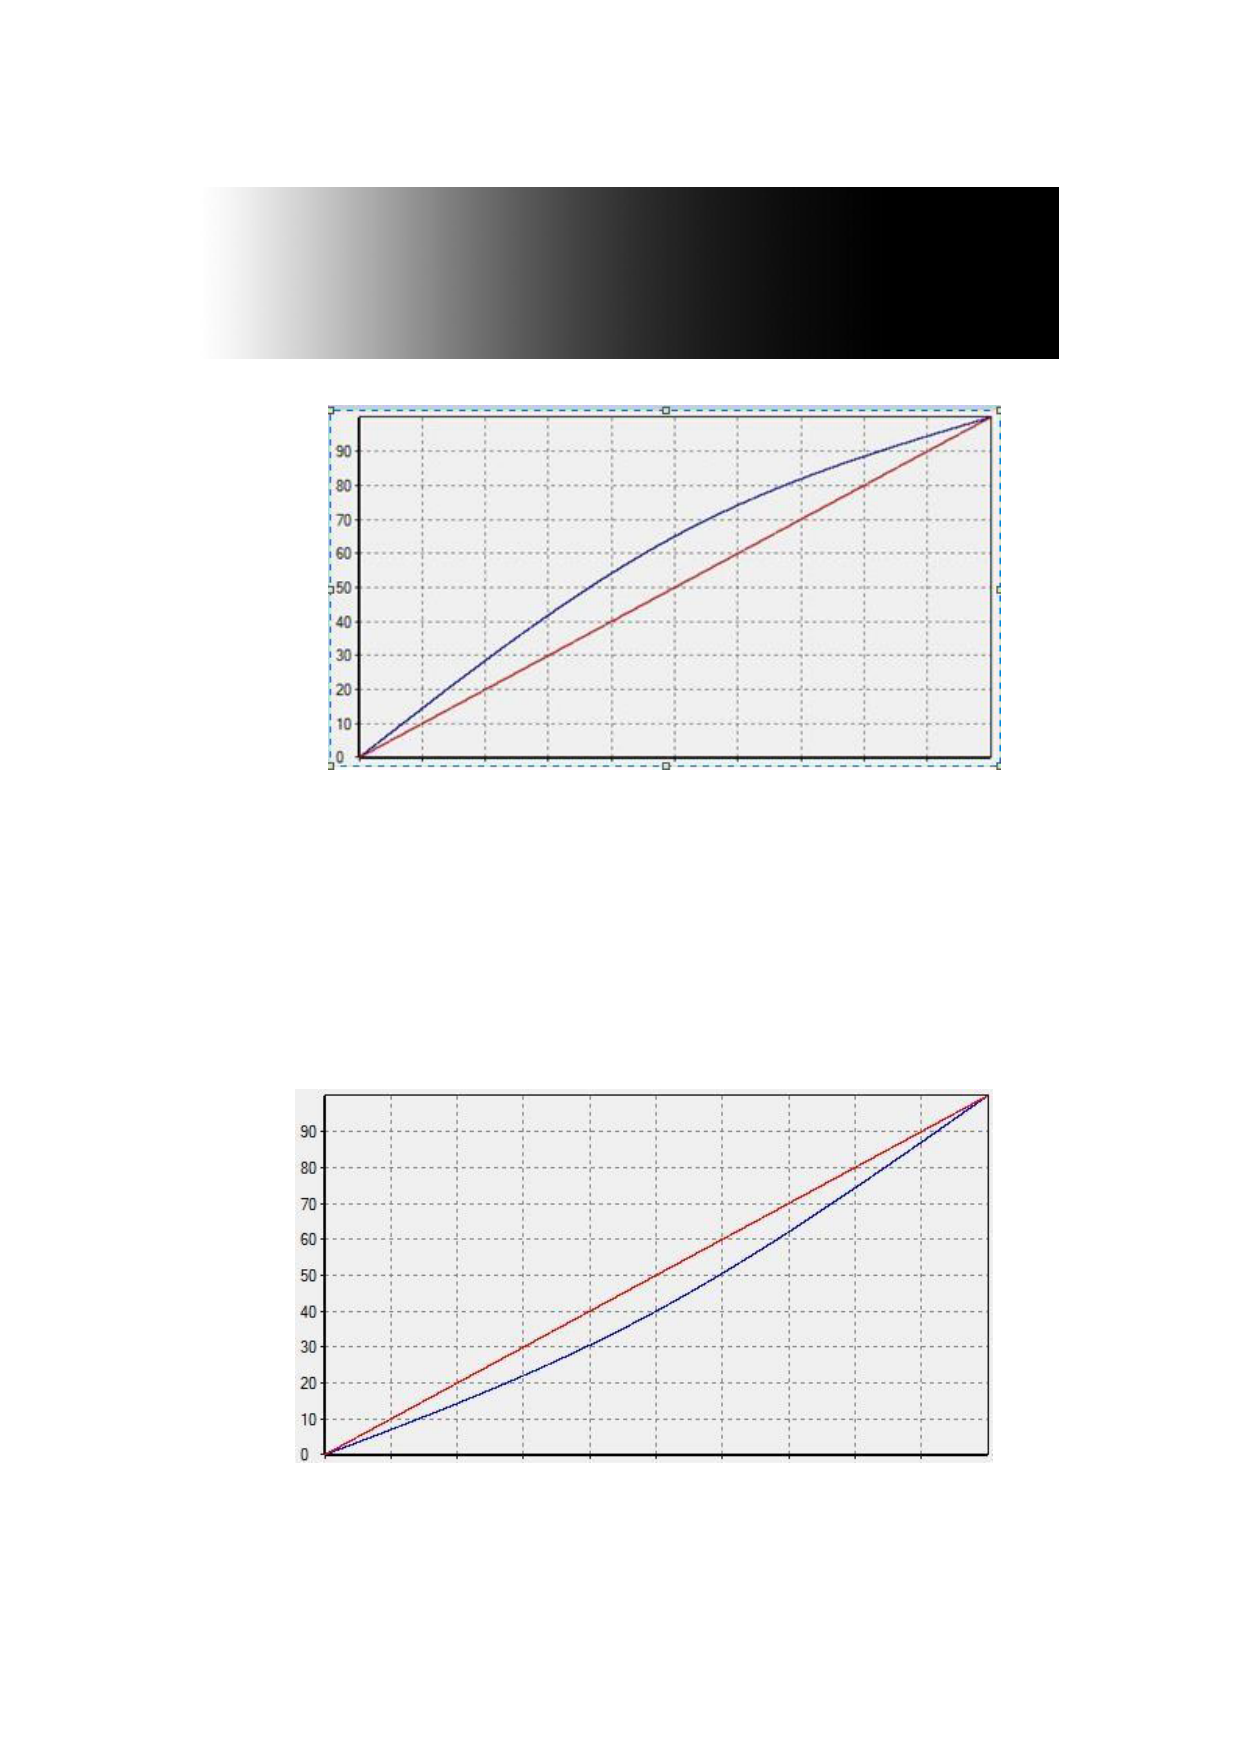
Figure 2 Gray linear gradient diagram
Figure 3 The dilution value of screening point is 1.0
Figure 3 shows the conditions when the screening point dilution value is 1.0, of which
the horizontal coordinate means the width change along the image, and the vertical
coordinate means the changes of concentration. Blue line means the actual change of image
concentration, and the red line means the trend of standard linear change. When the dilution
value increases to 2.5 and 4.0, the dilution degree shown in the concentration change curve
will grow accordingly, respectively as shown in Figure 4 and Figure 5.
Figure 4 The dilution value of screening point is 2.5
60 / 92

