
SAi ProfilerViewer ?? 2018-11-30 CT_am_v360x1440 .icc
Page 22
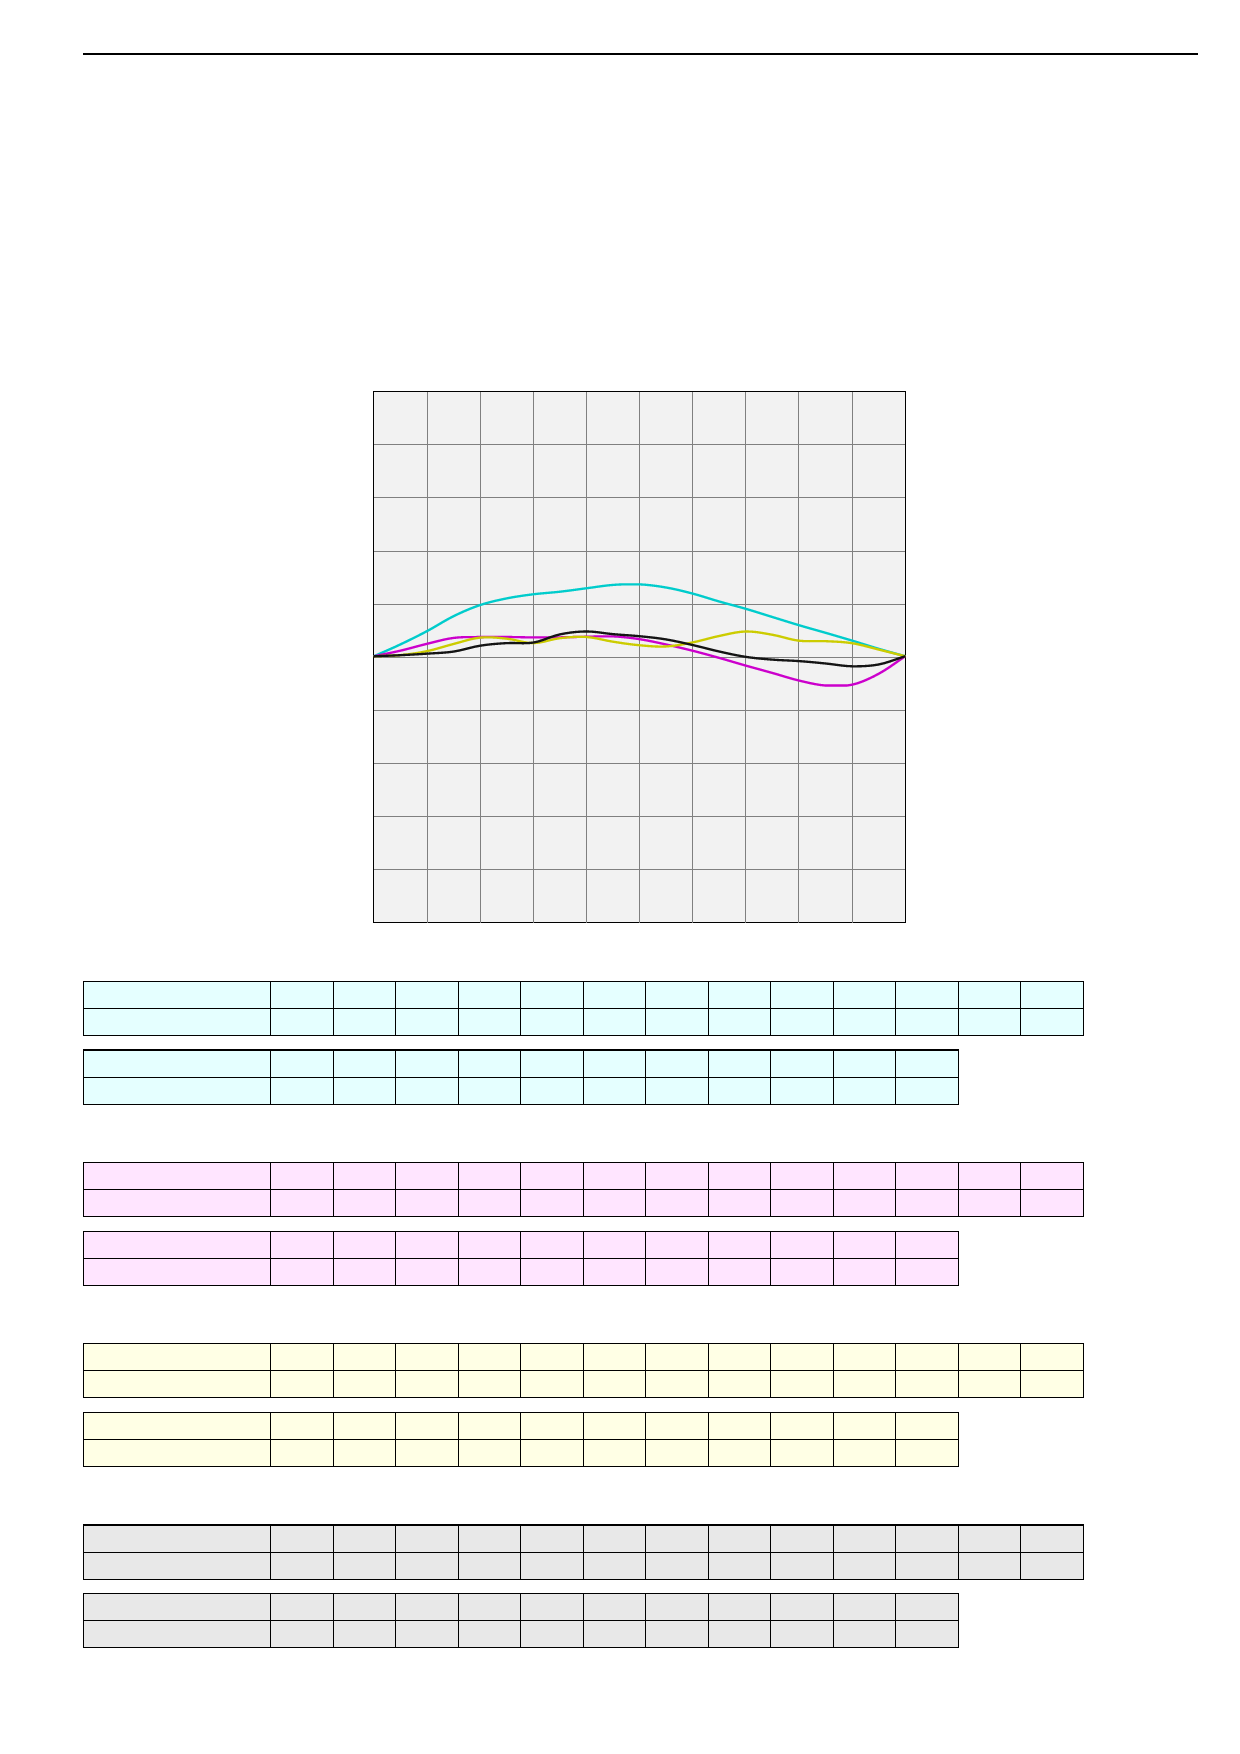
8. Linearity
Note: The dot gain cannot be estimated seriously from colorimetric data, therefore we display the deltaE-76 based
deviation from linear primaries.Unlike density curves a dot gain is not desirably for colorimetric curves. The colorimetry
respects visual distances better than density.
Colorimetric Linearity: The diagram shows the colorimetric linearity of the primaries.Flat curves indicate that the deltaE to
white and solid color is proportional.
50%
0%
100%
-50%
Cyan
Tone Value
1.00 2.00 3.00 4.00 5.00 7.00 10.00 15.00 20.00 25.00 30.00 35.00 40.00
Tone Value Increase 0.44 0.89 1.33 1.78 2.24 3.20 4.74 7.55 9.64 10.89 11.67 12.15 12.79
Tone Value
45.00 50.00 55.00 60.00 65.00 70.00 75.00 80.00 85.00 90.00 95.00
Tone Value Increase 13.43 13.53 12.94 11.79 10.30 8.93 7.38 5.85 4.42 2.94 1.41
Magenta
Tone Value
1.00 2.00 3.00 4.00 5.00 7.00 10.00 15.00 20.00 25.00 30.00 35.00 40.00
Tone Value Increase 0.22 0.43 0.64 0.85 1.05 1.47 2.35 3.45 3.62 3.63 3.55 3.57 3.67
Tone Value
45.00 50.00 55.00 60.00 65.00 70.00 75.00 80.00 85.00 90.00 95.00
Tone Value Increase 3.74 3.22 2.21 1.03 -0.31 -1.76 -3.15 -4.57 -5.51 -5.36 -3.30
Yellow
Tone Value
1.00 2.00 3.00 4.00 5.00 7.00 10.00 15.00 20.00 25.00 30.00 35.00 40.00
Tone Value Increase 0.04 0.07 0.11 0.16 0.22 0.36 0.96 2.32 3.51 3.31 2.47 3.40 3.63
Tone Value
45.00 50.00 55.00 60.00 65.00 70.00 75.00 80.00 85.00 90.00 95.00
Tone Value Increase 2.74 2.07 1.84 2.61 3.82 4.66 4.04 2.92 2.84 2.46 1.26
Black
Tone Value
1.00 2.00 3.00 4.00 5.00 7.00 10.00 15.00 20.00 25.00 30.00 35.00 40.00
Tone Value Increase 0.04 0.07 0.11 0.15 0.20 0.31 0.49 0.88 1.99 2.47 2.57 4.11 4.67
Tone Value
45.00 50.00 55.00 60.00 65.00 70.00 75.00 80.00 85.00 90.00 95.00
Tone Value Increase 4.16 3.77 3.17 2.11 0.89 -0.12 -0.64 -0.91 -1.36 -1.89 -1.55
 ProfileReport_CT_am_v360x1440")
 ProfileReport_CT_am_v360x1440")
 ProfileReport_CT_am_v360x1440")
 ProfileReport_CT_am_v360x1440")
 ProfileReport_CT_am_v360x1440")
 ProfileReport_CT_am_v360x1440")
 ProfileReport_CT_am_v360x1440")
 ProfileReport_CT_am_v360x1440")
 ProfileReport_CT_am_v360x1440")