
SAi ProfilerViewer ?? 2018-11-30 CT_am_v360x1440 .icc
Page 2
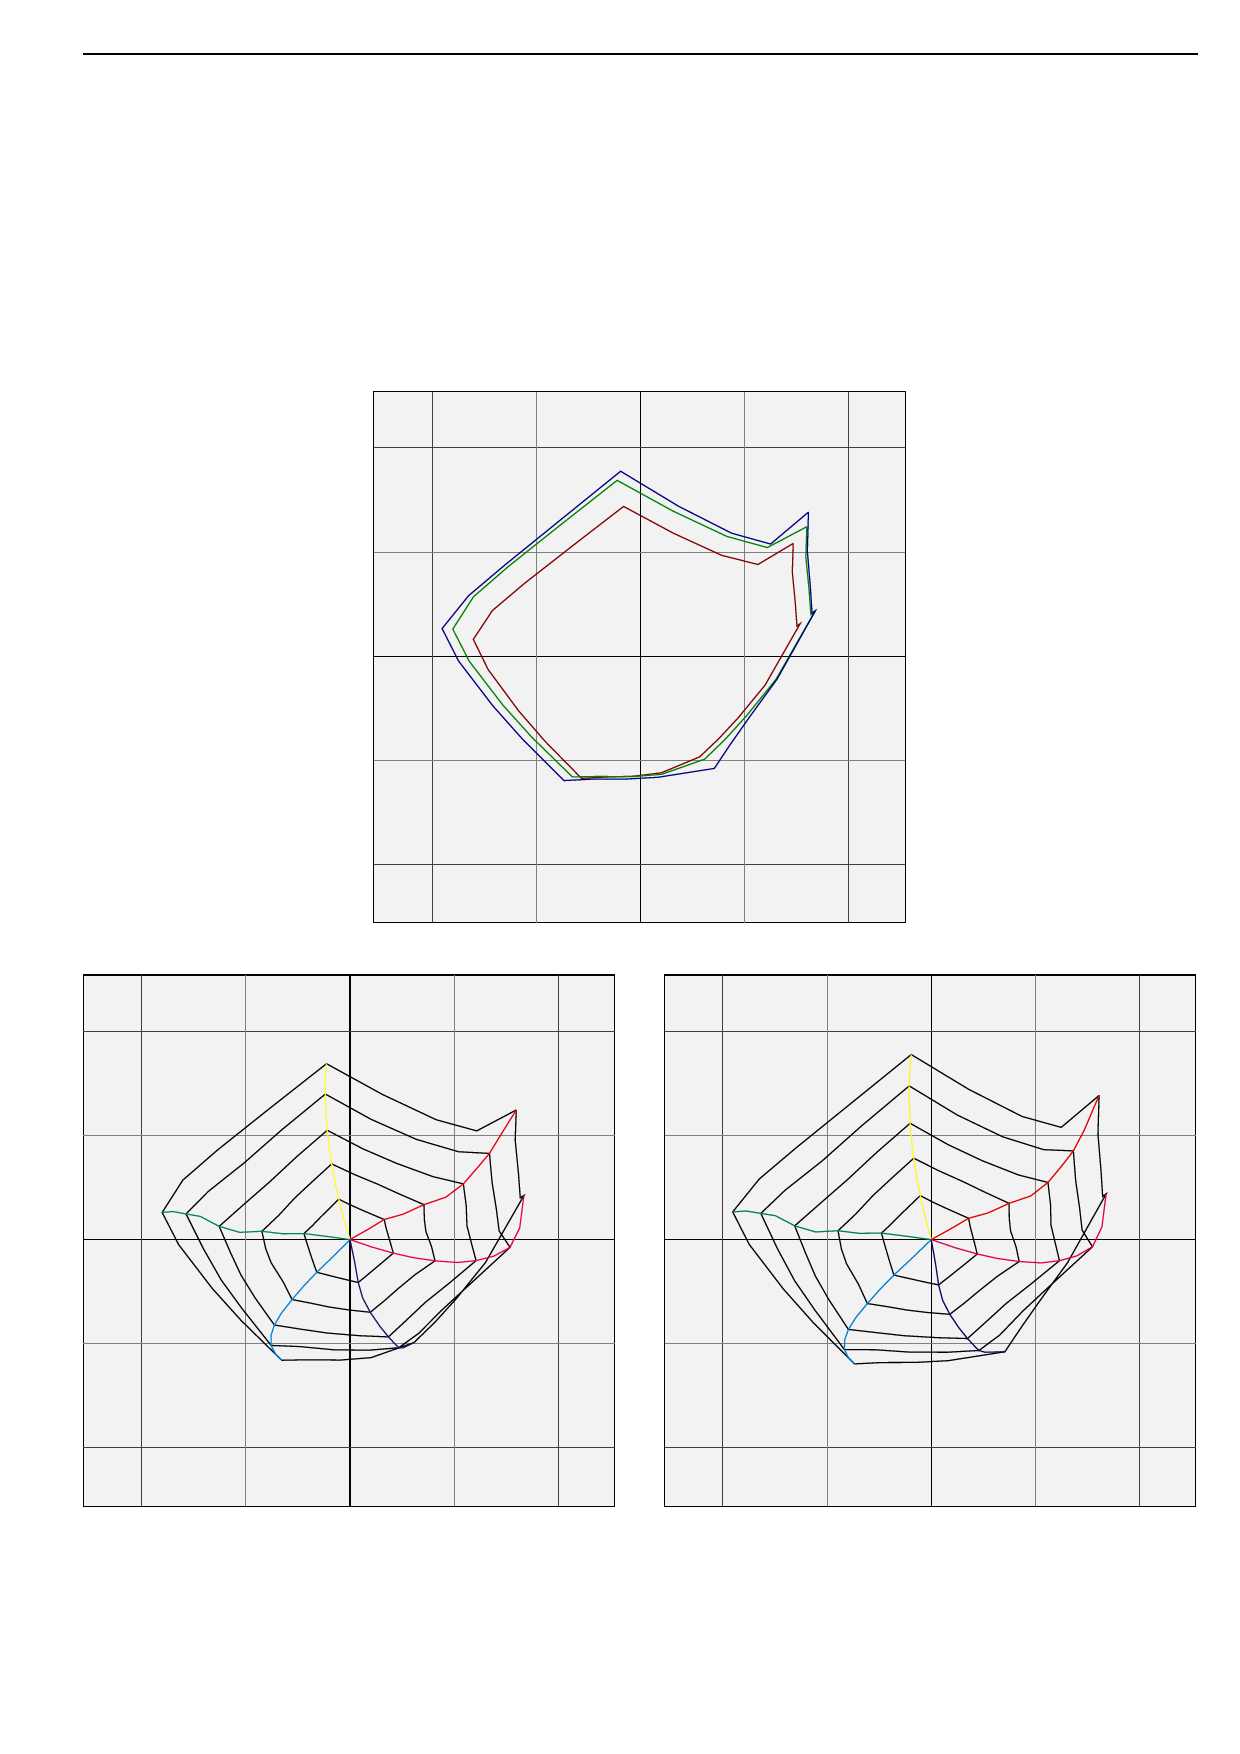
2. Gamut
The gamut plot illustrates the maximum gamuts in the a/b-diagram when converting from device color space to Lab.
These plots show the gamut for the different rendering intents.
Typically the perceptual gamut is the largest one and the absolute colorimetric gamut is the smallest.
b
100
-100
Perceptual
Relative Colorimetric
Absolute Colorimetric
-100
b
100
100
a
b
100
-100
100
a
-100
100
a
Relative Colorimetric
-100
Perceptual
-100
 ProfileReport_CT_am_v360x1440")
 ProfileReport_CT_am_v360x1440")
 ProfileReport_CT_am_v360x1440")
 ProfileReport_CT_am_v360x1440")
 ProfileReport_CT_am_v360x1440")
 ProfileReport_CT_am_v360x1440")
 ProfileReport_CT_am_v360x1440")
 ProfileReport_CT_am_v360x1440")
 ProfileReport_CT_am_v360x1440")