



Home
3D
PrintUP 3D Printer
PioCreat 3D Printer
Printers
FastCOLOUR >>
ATools
DTF Textile
UV-DTF
FlatPRINT
PrintExp
InkRIP
Lasers
TruCUT CO
2
>>
TruCUT RDWorks
TruCUT 2020+
TruCUT Express
TruCUT Lite >>
4030 & Vertical Software
4030 & Vertical Documents
New 6040 Desktop
LabelMark
RayCUT
MorCUT >>
MorCUT-Cyclops
LaserMaster
Plasmas
MetalWise
Fabricam
Routers
EasyRoute
PowerRoute
Blade Cutters
Vinyl Cutters >>
V-Series
V-Smart
V-Auto (& V-Smart+)
Vinyl4
Flatbed Cutters >>
FlatCUT
Label Cutters >>
V-Auto Label Cutters
Software >>
VinylCut
More
FastCUT
Heatware
Rollman
ScreenMaster
Other Software
Miscellaneous
AM.CO.ZA
/
Buy CNC Software
/
CNC Software Training
/
CNC Software Downloads
Sales: 072 222 2211
Support: 076 666 6655
Training: 060 818 1818
Jo’burg: 087 802 5368
Cape Town: 087 802 7106
An
Project
Multimedia
Univision Videos
#SortIT Videos
MakersLab.TV
Software Training
Welldone Gallery
Updates
Prevision Blog
Cornerstone Trust
Email Campaigns
Contact Us
Sales WhatsApp
060 600 6000
Support WhatsApp
060 600 7000
Johannesburg Headquarters
011 397 1429
087 802 5368
Cape Town Showroom
021 555 3250
087 802 7106
Links
CNC Machine Repair
Vinyl Cutter
Heatware
You are here:
AM.CO.ZA
Buythis
CNC Utilities Homepage
FastCOLOUR-Printer
FastCOLOUR ECO-Solvent Ink Generic ICC Profiles for XP600
ProfileReport_CT_am_v360x1440.pdf
Page 12 of 23
Profile-Test
2018-11-30
Profile Information
Name
CT_am_v360x1440 .icc
Path
C:/Program Files (x86)/SAi/.../AM.CO.ZA/CT_am_v360x1440 .icc
Size
1420400
Version
4.2
Class
prtr
ColorSpace
CMYK
PCS
Lab
Date
2018-11-30 23:31:34
Rendering
0
Creator
ScAm
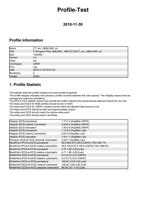
1. Profile Statistic
The statistic tests the profile integrity and some profile properties.
The profile integrity indicates how precise a profile converts between the color spaces. The integrity values show as
average and maximum deviations.
The DCS to PCS statistic shows how precise the profile matches the measurement data and should be very low.
The black point DCS for RGB profiles should be low or 0/0/0
The black point DCS for CMYK+ profiles should match the allowed total amount of ink.
The black point PCS should be dark and approximately neutral.
The white point DCS should match the device white point.
The white point PCS should match Lab-White.
Integrity (DCS) perceptual
1.1/11.4 (Avg/Max CMYK)
Integrity (DCS) relative colorimetric
0.9/16.4 (Avg/Max CMYK)
Integrity (DCS) saturation
1.9/13.9 (Avg/Max CMYK)
Integrity (PCS) perceptual
1.1/12.5 (Avg/Max Lab)
Integrity (PCS) relative colorimetric
0.6/7.8 (Avg/Max Lab)
Integrity (PCS) saturation
1.8/11.1 (Avg/Max Lab)
Precision (DCS-to-PCS) absolute colorimetric
0.4/6.7 (Avg/Max Lab)
BlackPoint (PCS-to-DCS) perceptual
90.5 99.9 97.5 99.9 (CMYK) TAC=387.7%
BlackPoint (PCS-to-DCS) relative colorimetric
90.8 100.0 97.8 100.0 (CMYK) TAC=388.5%
BlackPoint (PCS-to-PCS) perceptual
4.75 1.99 -0.59 (Lab)
BlackPoint (PCS-to-PCS) relative colorimetric
4.71 1.99 -0.58 (Lab)
WhitePoint (PCS-to-DCS) perceptual
0.0 0.0 0.0 0.0 (CMYK)
WhitePoint (PCS-to-DCS) relative colorimetric
0.0 0.0 0.0 0.0 (CMYK)
WhitePoint (DCS-to-PCS) perceptual
100.00 -0.00 0.00 (Lab)
WhitePoint (DCS-to-PCS) relative colorimetric
100.00 -0.00 0.00 (Lab)
WhitePoint (DCS-to-PCS) absolute colorimetric
88.34 2.07 -7.42 (Lab)
SAi ProfilerViewer ??
2018-11-30
CT_am_v360x1440 .icc
Page 2
2. Gamut
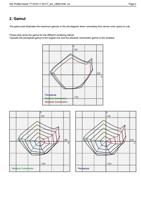
The gamut plot illustrates the maximum gamuts in the a/b-diagram when converting from device color space to Lab.
These plots show the gamut for the different rendering intents.
Typically the perceptual gamut is the largest one and the absolute colorimetric gamut is the smallest.
a
100
-100
b
100
-100
Absolute Colorimetric
Relative Colorimetric
Perceptual
a
100
-100
b
100
-100
Relative Colorimetric
a
100
-100
b
100
-100
Perceptual
SAi ProfilerViewer ??
2018-11-30
CT_am_v360x1440 .icc
Page 3
3. Gamut Volume
This table shows the gamut size in Lab and compares it to some standard color spaces.
AbsoluteColorimetric
Lab-Volume
%
Intersection
Union
CT_am_v360x1440 .icc
416596
100.0%
-
-
sRGB
826794
198.5%
80.6%
217.8%
AdobeRGB
1179791
283.2%
94.2%
289.0%
CoatedFOGRA39
369189
88.6%
75.7%
113.0%
SAi ProfilerViewer ??
2018-11-30
CT_am_v360x1440 .icc
Page 4
4. Gray Balance
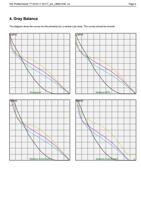
The diagram show the curves for the primaries for a neutral Lab-ramp. The curves should be smooth
L
CMYK
Perceptual
L
CMYK
Relative+BPC
L
CMYK
Relative Colorimetric
L
CMYK
Absolute Colorimetric
SAi ProfilerViewer ??
2018-11-30
CT_am_v360x1440 .icc
Page 5
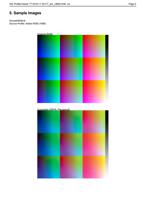
5. Sample Images
SmoothRGB.tif
Source Profile:
Adobe RGB (1998)
Original (RGB)
Converted (CMYK, Perceptual)
SAi ProfilerViewer ??
2018-11-30
CT_am_v360x1440 .icc
Page 6
Converted (CMYK, Colorimetric+BPC)
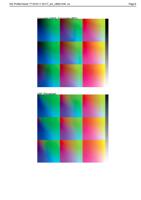
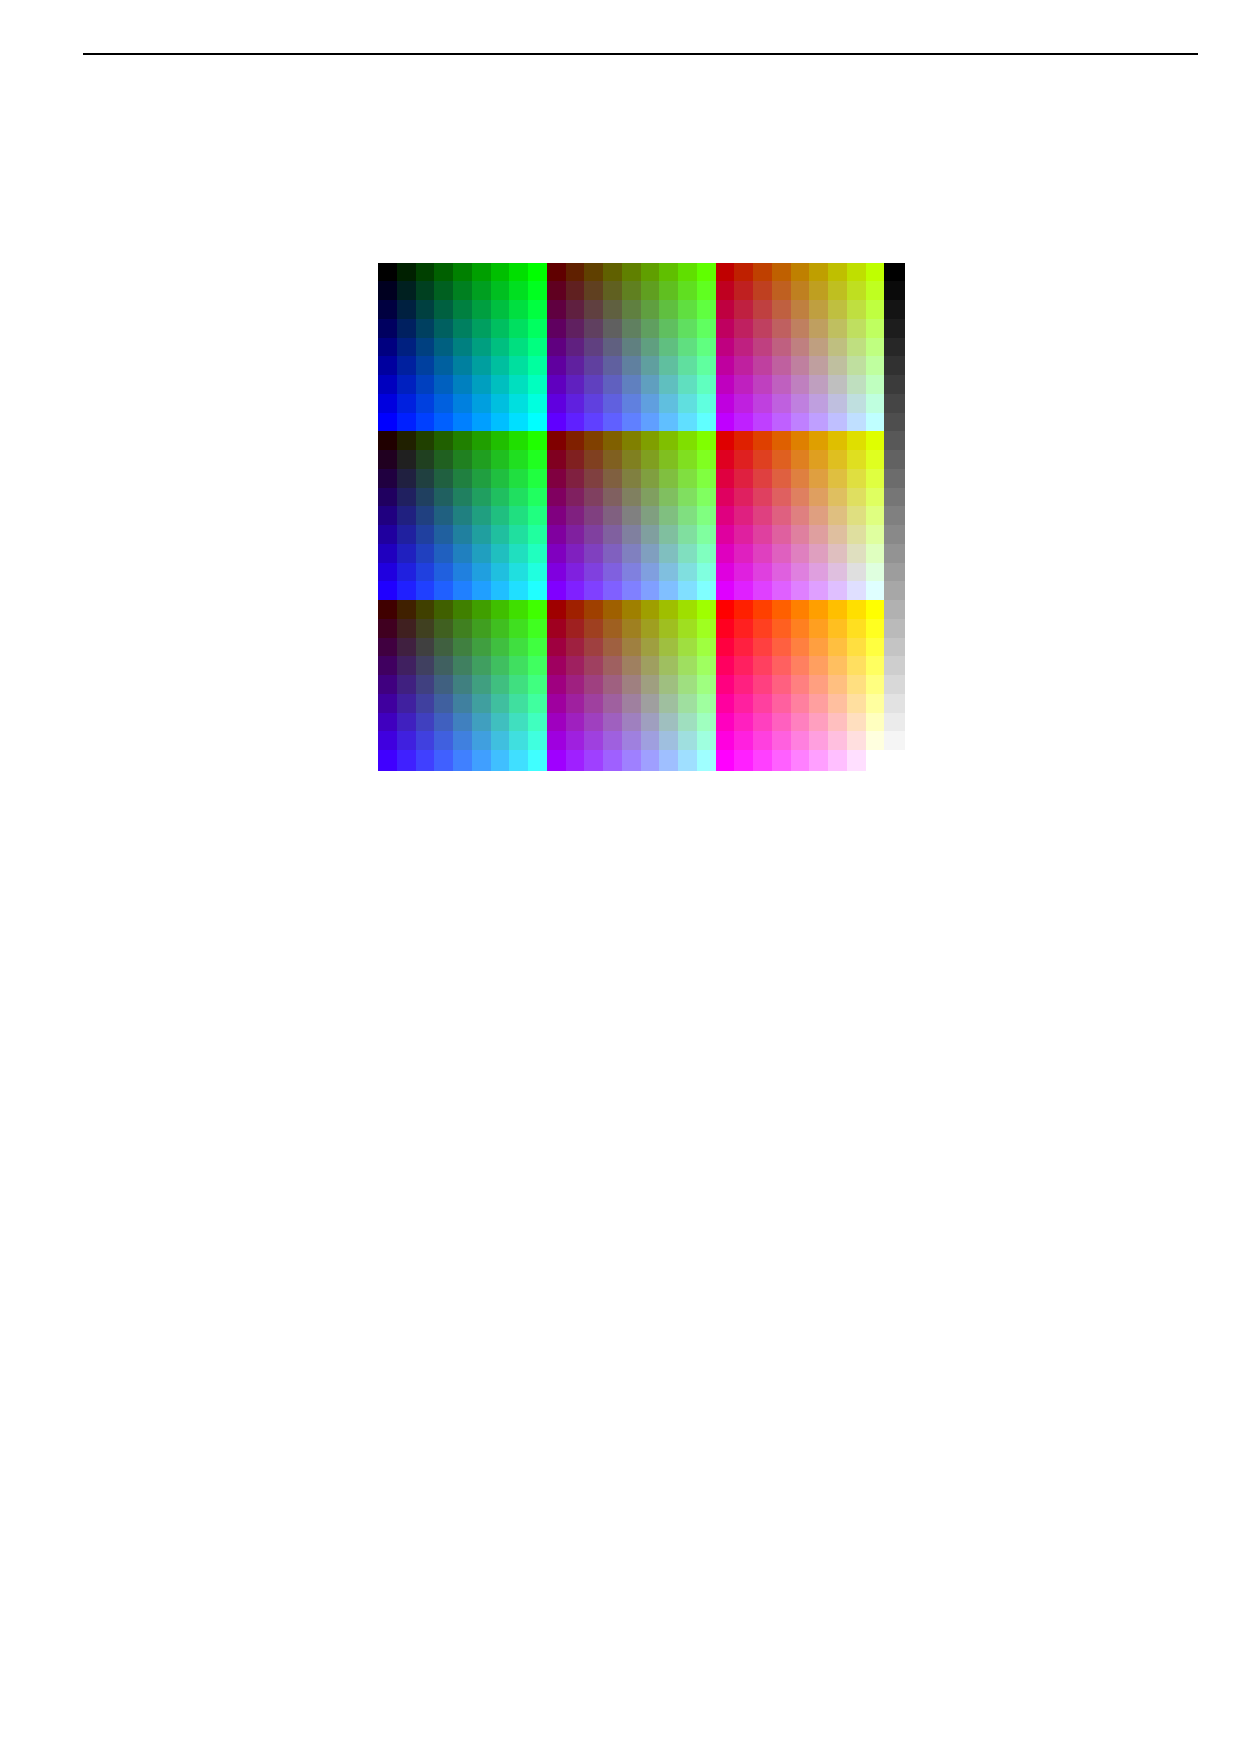
CMY (Perceptual)
SAi ProfilerViewer ??
2018-11-30
CT_am_v360x1440 .icc
Page 7
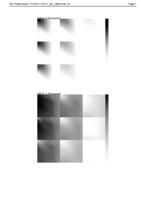
CMYK_K (Perceptual)
CMYK_C (Perceptual)
SAi ProfilerViewer ??
2018-11-30
CT_am_v360x1440 .icc
Page 8
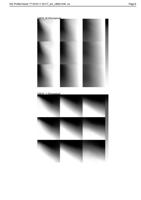
CMYK_M (Perceptual)
CMYK_Y (Perceptual)
SAi ProfilerViewer ??
2018-11-30
CT_am_v360x1440 .icc
Page 9
CLEditRGB.tif
Source Profile:
Adobe RGB (1998)
Original (RGB)
SAi ProfilerViewer ??
2018-11-30
CT_am_v360x1440 .icc
Page 10
Converted (CMYK, Perceptual)
"
Do you need help?
Call Me Back