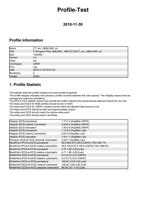
Profile-Test2018-11-30Profile InformationNameCT_am_v360x1440 .iccPathC:/Program Files (x86)/SAi/.../AM.CO.ZA/CT_am_v360x1440 .iccSize1420400Version4.2ClassprtrColorSpaceCMYKPCSLab Date2018-11-30 23:31:34Rendering0CreatorScAm1. Profile StatisticThe statistic tests the profile integrity and some profile properties.The profile integrity indicates how precise a profile converts between the color spaces. The integrity values show as average and maximum deviations.The DCS to PCS statistic shows how precise the profile matches the measurement data and should be very low.The black point DCS for RGB profiles should be low or 0/0/0The black point DCS for CMYK+ profiles should match the allowed total amount of ink.The black point PCS should be dark and approximately neutral.The white point DCS should match the device white point.The white point PCS should match Lab-White.Integrity (DCS) perceptual1.1/11.4 (Avg/Max CMYK)Integrity (DCS) relative colorimetric0.9/16.4 (Avg/Max CMYK)Integrity (DCS) saturation1.9/13.9 (Avg/Max CMYK)Integrity (PCS) perceptual1.1/12.5 (Avg/Max Lab)Integrity (PCS) relative colorimetric0.6/7.8 (Avg/Max Lab)Integrity (PCS) saturation1.8/11.1 (Avg/Max Lab)Precision (DCS-to-PCS) absolute colorimetric0.4/6.7 (Avg/Max Lab)BlackPoint (PCS-to-DCS) perceptual90.5 99.9 97.5 99.9 (CMYK) TAC=387.7%BlackPoint (PCS-to-DCS) relative colorimetric90.8 100.0 97.8 100.0 (CMYK) TAC=388.5%BlackPoint (PCS-to-PCS) perceptual4.75 1.99 -0.59 (Lab)BlackPoint (PCS-to-PCS) relative colorimetric4.71 1.99 -0.58 (Lab)WhitePoint (PCS-to-DCS) perceptual0.0 0.0 0.0 0.0 (CMYK)WhitePoint (PCS-to-DCS) relative colorimetric0.0 0.0 0.0 0.0 (CMYK)WhitePoint (DCS-to-PCS) perceptual100.00 -0.00 0.00 (Lab)WhitePoint (DCS-to-PCS) relative colorimetric100.00 -0.00 0.00 (Lab)WhitePoint (DCS-to-PCS) absolute colorimetric88.34 2.07 -7.42 (Lab)
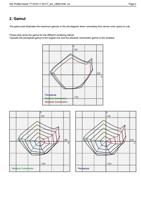
SAi ProfilerViewer ??2018-11-30CT_am_v360x1440 .iccPage 22. GamutThe gamut plot illustrates the maximum gamuts in the a/b-diagram when converting from device color space to Lab.These plots show the gamut for the different rendering intents.Typically the perceptual gamut is the largest one and the absolute colorimetric gamut is the smallest.a100-100b100-100Absolute ColorimetricRelative ColorimetricPerceptuala100-100b100-100Relative Colorimetrica100-100b100-100Perceptual
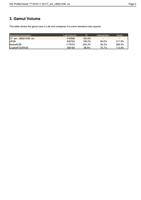
SAi ProfilerViewer ??2018-11-30CT_am_v360x1440 .iccPage 33. Gamut VolumeThis table shows the gamut size in Lab and compares it to some standard color spaces.AbsoluteColorimetricLab-Volume%IntersectionUnionCT_am_v360x1440 .icc 416596 100.0%--sRGB 826794 198.5% 80.6% 217.8%AdobeRGB 1179791 283.2% 94.2% 289.0%CoatedFOGRA39 369189 88.6% 75.7% 113.0%
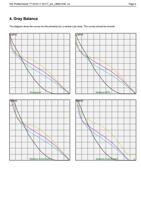
SAi ProfilerViewer ??2018-11-30CT_am_v360x1440 .iccPage 44. Gray BalanceThe diagram show the curves for the primaries for a neutral Lab-ramp. The curves should be smoothLCMYKPerceptualLCMYKRelative+BPCLCMYKRelative ColorimetricLCMYKAbsolute Colorimetric
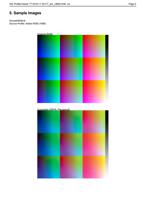
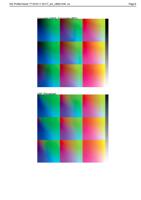
SAi ProfilerViewer ??2018-11-30CT_am_v360x1440 .iccPage 55. Sample ImagesSmoothRGB.tifSource Profile: Adobe RGB (1998)Original (RGB)Converted (CMYK, Perceptual)
SAi ProfilerViewer ??2018-11-30CT_am_v360x1440 .iccPage 6Converted (CMYK, Colorimetric+BPC)CMY (Perceptual)
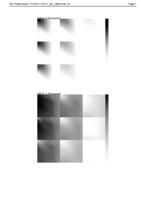
SAi ProfilerViewer ??2018-11-30CT_am_v360x1440 .iccPage 7CMYK_K (Perceptual)CMYK_C (Perceptual)
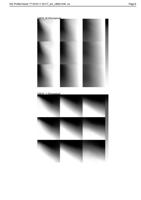
SAi ProfilerViewer ??2018-11-30CT_am_v360x1440 .iccPage 8CMYK_M (Perceptual)CMYK_Y (Perceptual)
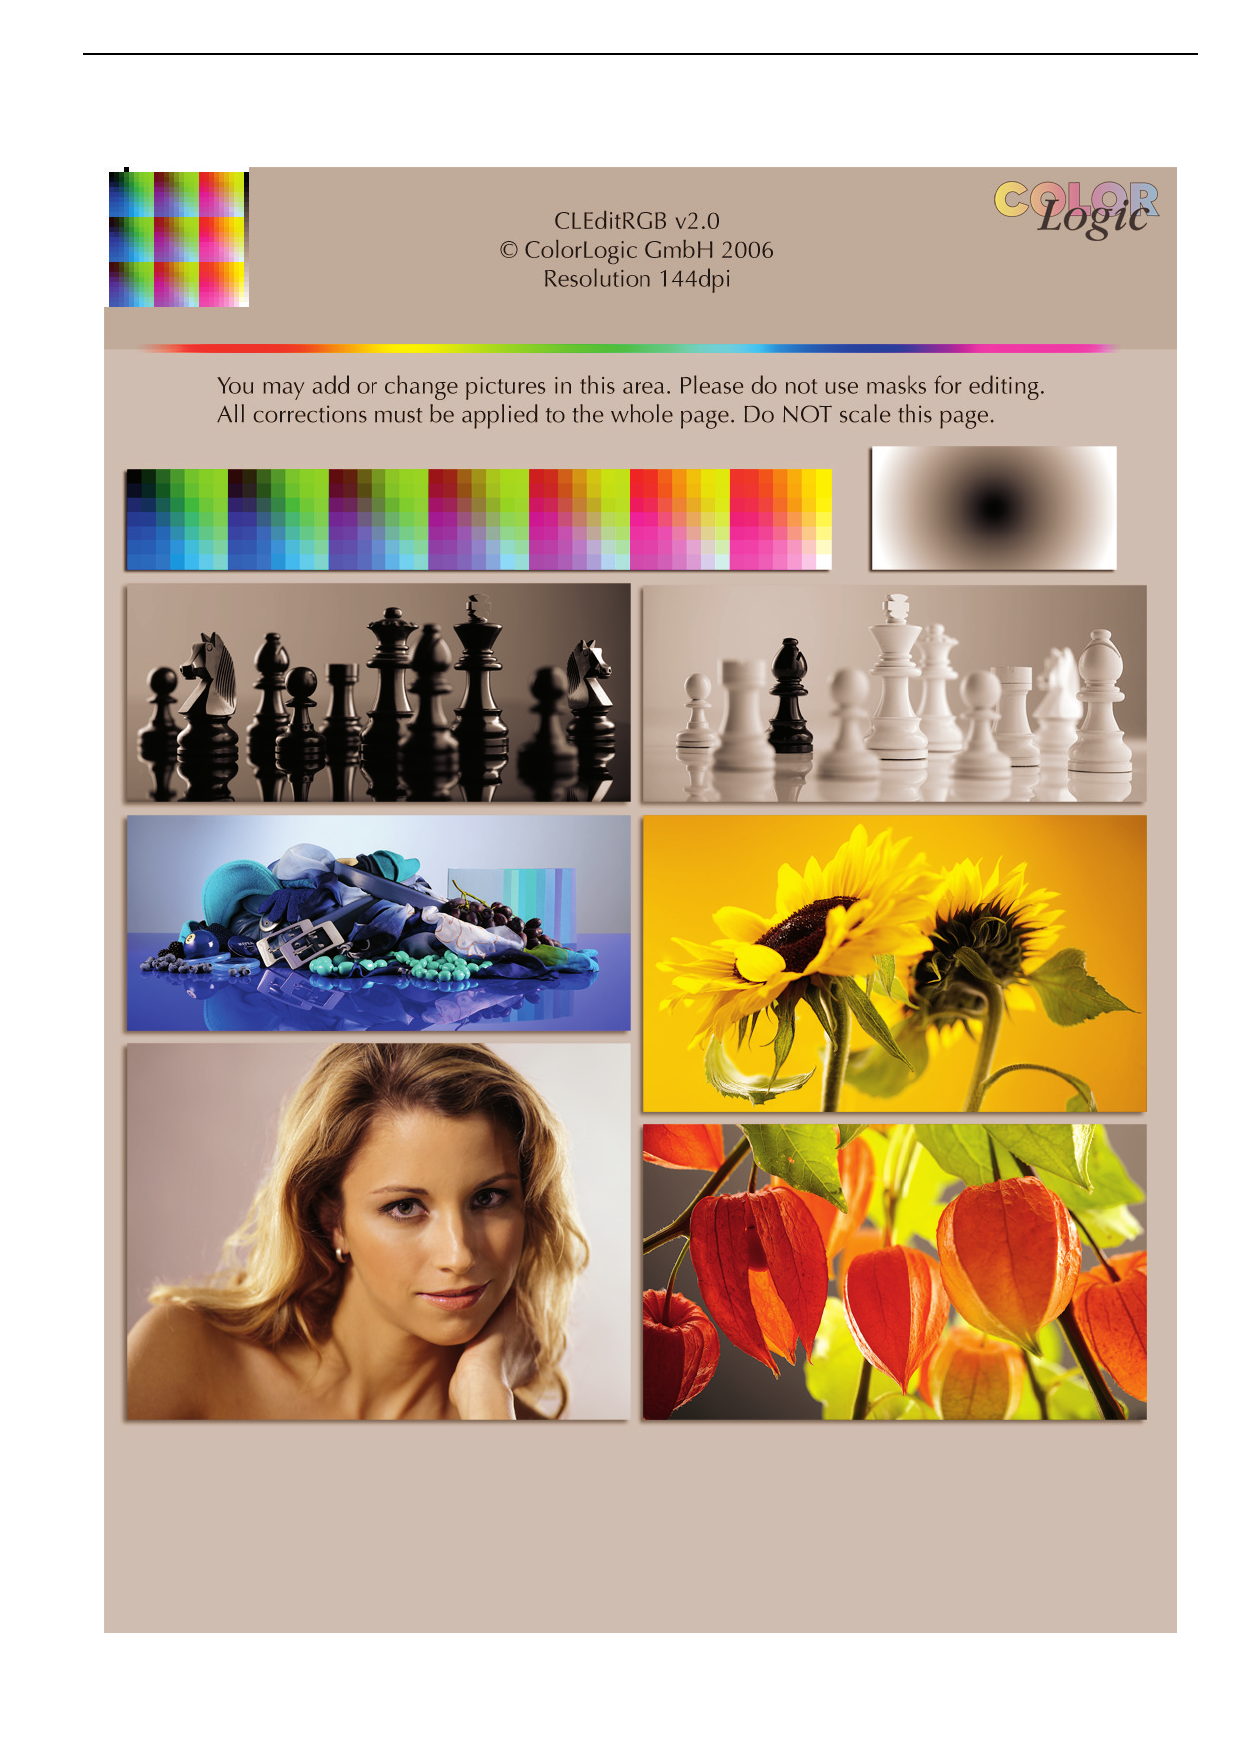
SAi ProfilerViewer ??2018-11-30CT_am_v360x1440 .iccPage 9CLEditRGB.tifSource Profile: Adobe RGB (1998)Original (RGB)
SAi ProfilerViewer ??2018-11-30CT_am_v360x1440 .iccPage 10Converted (CMYK, Perceptual)
    "